Switch Glacier:
NOTE: This page has been updated to show 2021 extents and changes
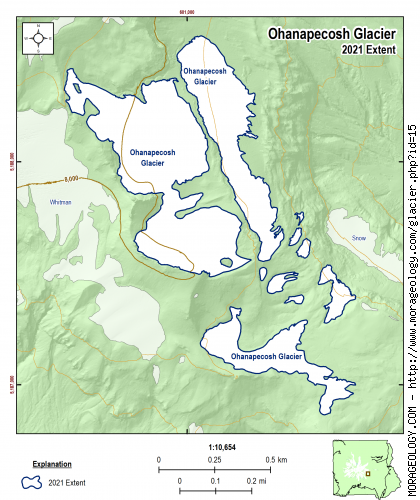
Ohanapecosh Glacier
This glacier on the lower part of the east side of Mount Rainier is south of Fryingpan Glacier. On its western end is Whitman Crest separating it from Whitman Glacier. The 1893 Fred G. Plummer map of the mountain calls the glacier Serviss for Professor Garrett P. Serviss, one of the leading science fiction writers and lecturers of the period. (Reese, 2009)
|
STATISTICS AS OF 2021 (Beason et al., 2022):
Aerial Extent:
0.238 ± 0.014 square miles
(0.616 ± 0.037 km2)
(Rank: 20 of 29)
Debris Cover (Based on Beason, 2017 - not updated in 2021):
--No appreciable debris cover in 2015--
Estimated Glacial Volume: (See notes below)
0.0030 cubic miles
(0.0127 km3)
Highest Elevation (Head):
8,392 feet
(2,558 m)
Lowest Elevation (Terminus):
7,250 feet
(2,210 m)
Elevation Range:
1,141 feet
(348 m)
Length:
2.02 miles
(3.25 km)
Average Slope:
21°
Average Flow Direction (Flows towards):
East northeast (72°)
|
|
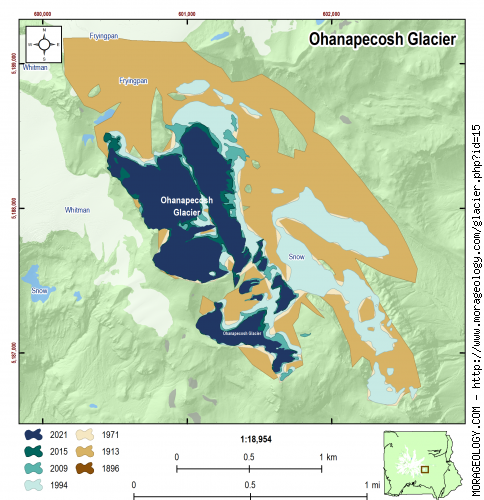
CHANGE IN EXTENT, 1896-2015 (Beason, 2017):
| Units |
1896 |
1913 |
1971 |
1994 |
2009 |
2015 |
2021 |
| Area, mi2 |
-- |
1.146 |
0.529 |
0.536 |
0.303 |
0.258 |
0.238 |
| Area, km2 |
-- |
2.968 |
1.369 |
1.389 |
0.786 |
0.669 |
0.616 |
Area change between periods
|
1913 |
1971 |
1994 |
2009 |
2015 |
2021 |
| 1896 |
1.146 mi2
(2.969 km2) |
0.529 mi2
(1.370 km2) |
0.537 mi2
(1.390 km2) |
0.304 mi2
(0.787 km2) |
0.259 mi2
(0.670 km2) |
0.238 mi2
(0.617 km2) |
| 1913 |
-- |
-0.617 mi2
(-1.598 km2) |
-0.610 mi2
(-1.579 km2) |
-0.843 mi2
(-2.182 km2) |
-0.888 mi2
(-2.299 km2) |
-0.908 mi2
(-2.352 km2) |
| 1971 |
|
-- |
0.007 mi2
(0.019 km2) |
-0.225 mi2
(-0.584 km2) |
-0.270 mi2
(-0.700 km2) |
-0.291 mi2
(-0.754 km2) |
| 1994 |
|
-- |
-0.233 mi2
(-0.603 km2) |
-0.278 mi2
(-0.720 km2) |
-0.299 mi2
(-0.773 km2) |
| 2009 |
|
-- |
-0.045 mi2
(-0.117 km2) |
-0.066 mi2
(-0.170 km2) |
| 2015 |
|
-- |
-0.021 mi2
(-0.053 km2) |
Percent change between periods
|
1913 |
1971 |
1994 |
2009 |
2015 |
2021 |
| 1896 |
-296,571.09 % |
-136,909.40 % |
-138,839.21 % |
-78,581.78 % |
-66,930.57 % |
-61,604.86 % |
| 1913 |
-- |
-53.85 % |
-53.20 % |
-73.53 % |
-77.46 % |
-79.25 % |
| 1971 |
|
-- |
1.41 % |
-42.63 % |
-51.15 % |
-55.04 % |
| 1994 |
|
-- |
-43.43 % |
-51.83 % |
-55.67 % |
| 2009 |
|
-- |
-14.85 % |
-21.63 % |
| 2015 |
|
-- |
-7.97 % |
|
ESTIMATED CHANGE IN VOLUME, 1896-2021 (Beason et al., 2022; George and Beason, 2017):
PLEASE see important notes about this, below...
| Units |
1896 |
1913 |
1971 |
1981* |
1994 |
2009 |
2015 |
2021 |
| Volume, mi3 |
-- |
0.0178 |
0.0075 |
0.0088 |
0.0076 |
0.0040 |
0.0033 |
0.0030 |
| Volume, km3 |
-- |
0.0742 |
0.0311 |
0.0368 |
0.0316 |
0.0166 |
0.0139 |
0.0127 |
* = 1981 was the only year that glacial volumes have been measured. See note below.
Basal Shear Stress (τ): 2,423.94 lbs/ft2
Volume change between periods
|
1913 |
1971 |
1981 |
1994 |
2009 |
2015 |
2021 |
| 1896 |
0.0178 mi3
(0.0742 km3) |
0.0075 mi3
(0.0311 km3) |
0.0088 mi3
(0.0368 km3) |
0.0076 mi3
(0.0316 km3) |
0.0040 mi3
(0.0166 km3) |
0.0033 mi3
(0.0139 km3) |
0.0030 mi3
(0.0127 km3) |
| 1913 |
-- |
-0.0103 mi3
(-0.0431 km3) |
-0.0090 mi3
(-0.0373 km3) |
-0.0102 mi3
(-0.0426 km3) |
-0.0138 mi3
(-0.0575 km3) |
-0.0145 mi3
(-0.0603 km3) |
-0.0148 mi3
(-0.0615 km3) |
| 1971 |
|
-- |
0.0014 mi3
(0.0057 km3) |
0.0001 mi3
(0.0005 km3) |
-0.0035 mi3
(-0.0144 km3) |
-0.0041 mi3
(-0.0172 km3) |
-0.0044 mi3
(-0.0184 km3) |
| 1981 |
|
-- |
-0.0013 mi3
(-0.0052 km3) |
-0.0048 mi3
(-0.0202 km3) |
-0.0055 mi3
(-0.0229 km3) |
-0.0058 mi3
(-0.0242 km3) |
| 1994 |
|
-- |
-0.0036 mi3
(-0.0149 km3) |
-0.0042 mi3
(-0.0177 km3) |
-0.0045 mi3
(-0.0189 km3) |
| 2009 |
|
-- |
-0.0007 mi3
(-0.0028 km3) |
-0.0010 mi3
(-0.0040 km3) |
| 2015 |
|
-- |
-0.0003 mi3
(-0.0012 km3) |
Percent change between periods
|
1913 |
1971 |
1981 |
1994 |
2009 |
2015 |
2021 |
| 1896 |
-7,415,719.53 % |
-3,109,192.18 % |
-3,681,284.00 % |
-3,158,529.60 % |
-1,664,890.06 % |
-1,389,769.74 % |
-1,265,933.74 % |
| 1913 |
-- |
-58.07 % |
-50.36 % |
-57.41 % |
-77.55 % |
-81.26 % |
-82.93 % |
| 1971 |
|
-- |
18.40 % |
1.59 % |
-46.45 % |
-55.30 % |
-59.29 % |
| 1981 |
|
-- |
-14.20 % |
-54.78 % |
-62.25 % |
-65.61 % |
| 1994 |
|
-- |
-47.29 % |
-56.00 % |
-59.92 % |
| 2009 |
|
-- |
-16.53 % |
-23.96 % |
| 2015 |
|
-- |
-8.91 % |
With the exception of data in 1981, all values here are calculated estimates based on work by Driedger and Kennard (1986), which calculates glacier volumes with the following equations:
If Glacier Length (L) > 8,500 ft:
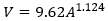
If Glacier Length (L) < 8,500 ft:
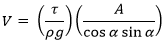
Basal shear stress (τ) is calculated as:
Where V is the calculated volume of the glacier (ft3), A is the calculated area of the glacier (ft2), ρ is the density of ice (1.779 slug/ft3), g is the acceleration of gravity (32.178 ft/s2), and α is the average slope of the glacier.
If you need a really good research project, recalculating the glacier volumes at Mount Rainier is the way to go!
|
NOTES:
Area was not measured for this glacier in 1896
Data References:
Beason et al., 2022,
Beason, 2017,
George and Beason, 2017,
Reese, 2009, and
Driedger and Kennard, 1986