Switch Glacier:
NOTE: This page has been updated to show 2021 extents and changes
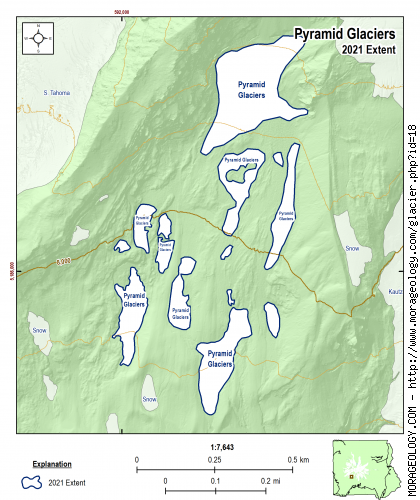
Pyramid Glaciers
This glacier on Mount Rainier is triangular in shape and is located between the Kautz and Wilson Glaciers. F. E. Matthes wrote, "...it bears no name, but certainly deserves one. Merely in order to give it a handle for ready reference....the writer will speak of it here as Pyramid Glacier." (Reese, 2009)
|
STATISTICS AS OF 2021 (Beason et al., 2022):
Aerial Extent:
0.077 ± 0.005 square miles
(0.201 ± 0.014 km2)
(Rank: 26 of 29)
Debris Cover (Based on Beason, 2017 - not updated in 2021):
--No appreciable debris cover in 2015--
Estimated Glacial Volume: (See notes below)
0.0009 cubic miles
(0.0036 km3)
Highest Elevation (Head):
8,881 feet
(2,707 m)
Lowest Elevation (Terminus):
7,673 feet
(2,339 m)
Elevation Range:
1,207 feet
(368 m)
Length:
0.59 miles
(0.95 km)
Average Slope:
23°
Average Flow Direction (Flows towards):
South (185°)
|
|
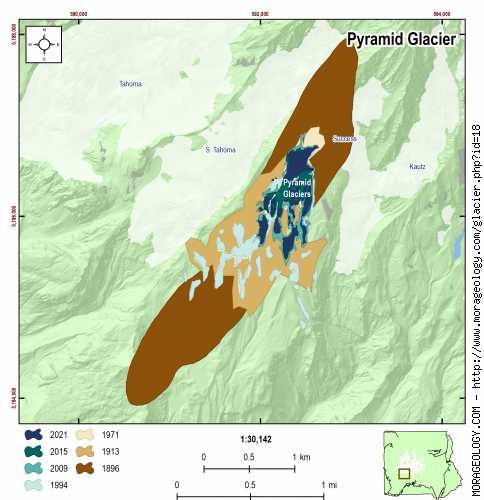
CHANGE IN EXTENT, 1896-2015 (Beason, 2017):
| Units |
1896 |
1913 |
1971 |
1994 |
2009 |
2015 |
2021 |
| Area, mi2 |
1.061 |
0.538 |
0.274 |
0.249 |
0.146 |
0.101 |
0.077 |
| Area, km2 |
2.747 |
1.394 |
0.710 |
0.645 |
0.379 |
0.262 |
0.201 |
Area change between periods
|
1913 |
1971 |
1994 |
2009 |
2015 |
2021 |
| 1896 |
-0.522 mi2
(-1.353 km2) |
-0.787 mi2
(-2.037 km2) |
-0.812 mi2
(-2.102 km2) |
-0.914 mi2
(-2.368 km2) |
-0.959 mi2
(-2.485 km2) |
-0.983 mi2
(-2.546 km2) |
| 1913 |
-- |
-0.264 mi2
(-0.685 km2) |
-0.289 mi2
(-0.749 km2) |
-0.392 mi2
(-1.015 km2) |
-0.437 mi2
(-1.132 km2) |
-0.461 mi2
(-1.194 km2) |
| 1971 |
|
-- |
-0.025 mi2
(-0.065 km2) |
-0.128 mi2
(-0.331 km2) |
-0.173 mi2
(-0.447 km2) |
-0.197 mi2
(-0.509 km2) |
| 1994 |
|
-- |
-0.103 mi2
(-0.266 km2) |
-0.148 mi2
(-0.383 km2) |
-0.172 mi2
(-0.444 km2) |
| 2009 |
|
-- |
-0.045 mi2
(-0.116 km2) |
-0.069 mi2
(-0.178 km2) |
| 2015 |
|
-- |
-0.024 mi2
(-0.062 km2) |
Percent change between periods
|
1913 |
1971 |
1994 |
2009 |
2015 |
2021 |
| 1896 |
-49.25 % |
-74.17 % |
-76.52 % |
-86.22 % |
-90.45 % |
-92.70 % |
| 1913 |
-- |
-49.10 % |
-53.73 % |
-72.84 % |
-81.19 % |
-85.62 % |
| 1971 |
|
-- |
-9.10 % |
-46.63 % |
-63.04 % |
-71.74 % |
| 1994 |
|
-- |
-41.29 % |
-59.34 % |
-68.91 % |
| 2009 |
|
-- |
-30.75 % |
-47.04 % |
| 2015 |
|
-- |
-23.53 % |
|
ESTIMATED CHANGE IN VOLUME, 1896-2021 (Beason et al., 2022; George and Beason, 2017):
PLEASE see important notes about this, below...
| Units |
1896 |
1913 |
1971 |
1981* |
1994 |
2009 |
2015 |
2021 |
| Volume, mi3 |
0.0163 |
0.0076 |
0.0036 |
0.0027 |
0.0032 |
0.0018 |
0.0012 |
0.0009 |
| Volume, km3 |
0.0680 |
0.0317 |
0.0148 |
0.0113 |
0.0133 |
0.0073 |
0.0049 |
0.0036 |
* = 1981 was the only year that glacial volumes have been measured. See note below.
Basal Shear Stress (τ): 2,193.17 lbs/ft2
Volume change between periods
|
1913 |
1971 |
1981 |
1994 |
2009 |
2015 |
2021 |
| 1896 |
-0.0087 mi3
(-0.0363 km3) |
-0.0127 mi3
(-0.0531 km3) |
-0.0136 mi3
(-0.0567 km3) |
-0.0131 mi3
(-0.0546 km3) |
-0.0146 mi3
(-0.0607 km3) |
-0.0151 mi3
(-0.0631 km3) |
-0.0154 mi3
(-0.0644 km3) |
| 1913 |
-- |
-0.0040 mi3
(-0.0169 km3) |
-0.0049 mi3
(-0.0204 km3) |
-0.0044 mi3
(-0.0184 km3) |
-0.0059 mi3
(-0.0244 km3) |
-0.0064 mi3
(-0.0269 km3) |
-0.0067 mi3
(-0.0281 km3) |
| 1971 |
|
-- |
-0.0008 mi3
(-0.0035 km3) |
-0.0004 mi3
(-0.0015 km3) |
-0.0018 mi3
(-0.0075 km3) |
-0.0024 mi3
(-0.0100 km3) |
-0.0027 mi3
(-0.0113 km3) |
| 1981 |
|
-- |
0.0005 mi3
(0.0020 km3) |
-0.0010 mi3
(-0.0040 km3) |
-0.0016 mi3
(-0.0065 km3) |
-0.0019 mi3
(-0.0077 km3) |
| 1994 |
|
-- |
-0.0014 mi3
(-0.0060 km3) |
-0.0020 mi3
(-0.0085 km3) |
-0.0023 mi3
(-0.0098 km3) |
| 2009 |
|
-- |
-0.0006 mi3
(-0.0025 km3) |
-0.0009 mi3
(-0.0037 km3) |
| 2015 |
|
-- |
-0.0003 mi3
(-0.0013 km3) |
Percent change between periods
|
1913 |
1971 |
1981 |
1994 |
2009 |
2015 |
2021 |
| 1896 |
-53.34 % |
-78.16 % |
-83.34 % |
-80.38 % |
-89.22 % |
-92.87 % |
-94.72 % |
| 1913 |
-- |
-53.19 % |
-64.29 % |
-57.95 % |
-76.89 % |
-84.71 % |
-88.69 % |
| 1971 |
|
-- |
-23.71 % |
-10.17 % |
-50.63 % |
-67.33 % |
-75.84 % |
| 1981 |
|
-- |
17.75 % |
-35.29 % |
-57.18 % |
-68.33 % |
| 1994 |
|
-- |
-45.04 % |
-63.64 % |
-73.10 % |
| 2009 |
|
-- |
-33.83 % |
-51.06 % |
| 2015 |
|
-- |
-26.04 % |
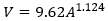
With the exception of data in 1981, all values here are calculated estimates based on work by Driedger and Kennard (1986), which calculates glacier volumes with the following equations:
If Glacier Length (L) > 8,500 ft:
If Glacier Length (L) < 8,500 ft:
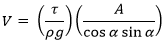
Basal shear stress (τ) is calculated as:
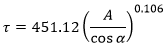
Where V is the calculated volume of the glacier (ft3), A is the calculated area of the glacier (ft2), ρ is the density of ice (1.779 slug/ft3), g is the acceleration of gravity (32.178 ft/s2), and α is the average slope of the glacier.
If you need a really good research project, recalculating the glacier volumes at Mount Rainier is the way to go!
|
NOTES:
Data References:
Beason et al., 2022,
Beason, 2017,
George and Beason, 2017,
Reese, 2009, and
Driedger and Kennard, 1986