Switch Glacier:
NOTE: This page has been updated to show 2021 extents and changes
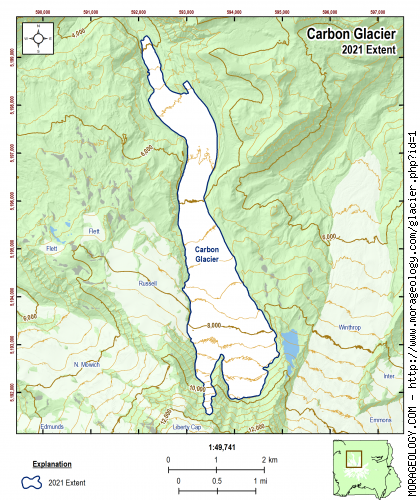
Carbon Glacier
The Carbon Glacier is on the northwest side of Mount Rainier. Its name comes from the "dirty" color of the water as it comes from the snout of the glacier when large amounts of rock and gravel are released as the ice melts. The Carbon River flows from the glacier through a valley with coal deposits that were once mined extensively. (Reese, 2009)
|
STATISTICS AS OF 2021 (Beason et al., 2022):
Aerial Extent:
2.722 ± 0.145 square miles
(7.049 ± 0.374 km2)
(Rank: 3 of 29)
Debris Cover (Based on Beason, 2017 - not updated in 2021):
1.870 ± 0.105 square miles
(4.844 ± 0.271 km2)
(Rank: 1 of 29)
Estimated Glacial Volume: (See notes below)
0.0732 cubic miles
(0.3053 km3)
Highest Elevation (Head):
12,212 feet
(3,722 m)
Lowest Elevation (Terminus):
3,617 feet
(1,102 m)
Elevation Range:
8,594 feet
(2,620 m)
Length:
5.02 miles
(8.08 km)
Average Slope:
20°
Average Flow Direction (Flows towards):
North (353°)
|
|
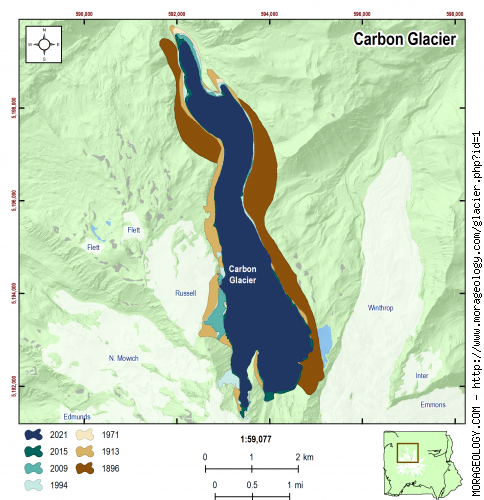
CHANGE IN EXTENT, 1896-2015 (Beason, 2017):
| Units |
1896 |
1913 |
1971 |
1994 |
2009 |
2015 |
2021 |
| Area, mi2 |
3.201 |
3.265 |
3.094 |
3.080 |
2.878 |
2.802 |
2.722 |
| Area, km2 |
8.290 |
8.455 |
8.014 |
7.976 |
7.454 |
7.257 |
7.049 |
Area change between periods
|
1913 |
1971 |
1994 |
2009 |
2015 |
2021 |
| 1896 |
0.064 mi2
(0.165 km2) |
-0.107 mi2
(-0.277 km2) |
-0.121 mi2
(-0.314 km2) |
-0.323 mi2
(-0.836 km2) |
-0.399 mi2
(-1.034 km2) |
-0.479 mi2
(-1.241 km2) |
| 1913 |
-- |
-0.171 mi2
(-0.442 km2) |
-0.185 mi2
(-0.479 km2) |
-0.386 mi2
(-1.001 km2) |
-0.463 mi2
(-1.199 km2) |
-0.543 mi2
(-1.406 km2) |
| 1971 |
|
-- |
-0.015 mi2
(-0.038 km2) |
-0.216 mi2
(-0.559 km2) |
-0.292 mi2
(-0.757 km2) |
-0.372 mi2
(-0.964 km2) |
| 1994 |
|
-- |
-0.201 mi2
(-0.522 km2) |
-0.278 mi2
(-0.719 km2) |
-0.358 mi2
(-0.927 km2) |
| 2009 |
|
-- |
-0.076 mi2
(-0.198 km2) |
-0.156 mi2
(-0.405 km2) |
| 2015 |
|
-- |
-0.080 mi2
(-0.207 km2) |
Percent change between periods
|
1913 |
1971 |
1994 |
2009 |
2015 |
2021 |
| 1896 |
1.99 % |
-3.34 % |
-3.79 % |
-10.08 % |
-12.47 % |
-14.97 % |
| 1913 |
-- |
-5.22 % |
-5.67 % |
-11.84 % |
-14.18 % |
-16.63 % |
| 1971 |
|
-- |
-0.47 % |
-6.98 % |
-9.45 % |
-12.03 % |
| 1994 |
|
-- |
-6.54 % |
-9.02 % |
-11.62 % |
| 2009 |
|
-- |
-2.65 % |
-5.43 % |
| 2015 |
|
-- |
-2.86 % |
|
ESTIMATED CHANGE IN VOLUME, 1896-2021 (Beason et al., 2022; George and Beason, 2017):
PLEASE see important notes about this, below...
| Units |
1896 |
1913 |
1971 |
1981* |
1994 |
2009 |
2015 |
2021 |
| Volume, mi3 |
0.0864 |
0.0881 |
0.0835 |
0.1705 |
0.0831 |
0.0777 |
0.0756 |
0.0732 |
| Volume, km3 |
0.3601 |
0.3673 |
0.3481 |
0.7108 |
0.3465 |
0.3238 |
0.3152 |
0.3053 |
* = 1981 was the only year that glacial volumes have been measured. See note below.
Basal Shear Stress (τ): 3,129.46 lbs/ft2
Volume change between periods
|
1913 |
1971 |
1981 |
1994 |
2009 |
2015 |
2021 |
| 1896 |
0.0017 mi3
(0.0072 km3) |
-0.0029 mi3
(-0.0120 km3) |
0.0841 mi3
(0.3506 km3) |
-0.0033 mi3
(-0.0137 km3) |
-0.0087 mi3
(-0.0363 km3) |
-0.0108 mi3
(-0.0449 km3) |
-0.0132 mi3
(-0.0548 km3) |
| 1913 |
-- |
-0.0046 mi3
(-0.0192 km3) |
0.0824 mi3
(0.3434 km3) |
-0.0050 mi3
(-0.0208 km3) |
-0.0104 mi3
(-0.0435 km3) |
-0.0125 mi3
(-0.0521 km3) |
-0.0149 mi3
(-0.0620 km3) |
| 1971 |
|
-- |
0.0870 mi3
(0.3626 km3) |
-0.0004 mi3
(-0.0016 km3) |
-0.0058 mi3
(-0.0243 km3) |
-0.0079 mi3
(-0.0329 km3) |
-0.0103 mi3
(-0.0428 km3) |
| 1981 |
|
-- |
-0.0874 mi3
(-0.3643 km3) |
-0.0928 mi3
(-0.3869 km3) |
-0.0949 mi3
(-0.3955 km3) |
-0.0973 mi3
(-0.4055 km3) |
| 1994 |
|
-- |
-0.0054 mi3
(-0.0227 km3) |
-0.0075 mi3
(-0.0312 km3) |
-0.0099 mi3
(-0.0412 km3) |
| 2009 |
|
-- |
-0.0021 mi3
(-0.0086 km3) |
-0.0044 mi3
(-0.0185 km3) |
| 2015 |
|
-- |
-0.0024 mi3
(-0.0099 km3) |
Percent change between periods
|
1913 |
1971 |
1981 |
1994 |
2009 |
2015 |
2021 |
| 1896 |
1.99 % |
-3.34 % |
97.36 % |
-3.79 % |
-10.08 % |
-12.47 % |
-15.23 % |
| 1913 |
-- |
-5.22 % |
93.50 % |
-5.67 % |
-11.84 % |
-14.18 % |
-16.88 % |
| 1971 |
|
-- |
104.17 % |
-0.47 % |
-6.98 % |
-9.45 % |
-12.30 % |
| 1981 |
|
-- |
-51.25 % |
-54.44 % |
-55.65 % |
-57.05 % |
| 1994 |
|
-- |
-6.54 % |
-9.02 % |
-11.89 % |
| 2009 |
|
-- |
-2.65 % |
-5.72 % |
| 2015 |
|
-- |
-3.16 % |
With the exception of data in 1981, all values here are calculated estimates based on work by Driedger and Kennard (1986), which calculates glacier volumes with the following equations:
If Glacier Length (L) > 8,500 ft:
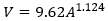
If Glacier Length (L) < 8,500 ft:
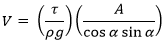
Basal shear stress (τ) is calculated as:
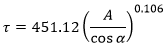
Where V is the calculated volume of the glacier (ft3), A is the calculated area of the glacier (ft2), ρ is the density of ice (1.779 slug/ft3), g is the acceleration of gravity (32.178 ft/s2), and α is the average slope of the glacier.
If you need a really good research project, recalculating the glacier volumes at Mount Rainier is the way to go!
|
NOTES:
Data References:
Beason et al., 2022,
Beason, 2017,
George and Beason, 2017,
Reese, 2009, and
Driedger and Kennard, 1986