Switch Glacier:
NOTE: This page has been updated to show 2021 extents and changes
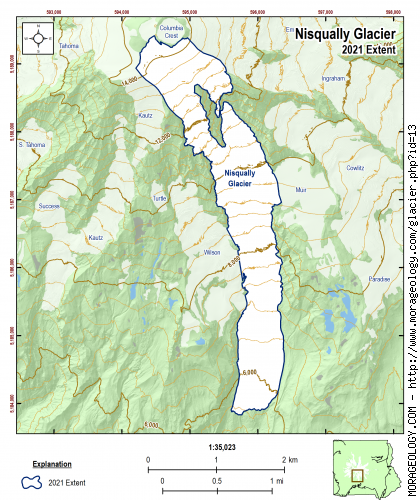
Nisqually Glacier
The Nisqually Glacier is on the south side of Mount Rainier and gives rise to the Nisqually River. It is the most visited glacier on the mountain with its lower end lying close to the Longmire to Paradise Road. It is one of the several glaciers that extend from the top of the mountain and was the route used by August V. Kautz and his party on their attempted summit climb in July of 1857.
According to the editors of Northwest Discovery magazine the first use of the name Nisqually Glacier was in late 1870 when it was so named in a letter written by Samuel F. Emmons to Clarence King. (Reese, 2009)
|
STATISTICS AS OF 2021 (Beason et al., 2022):
Aerial Extent:
1.569 ± 0.085 square miles
(4.064 ± 0.220 km2)
(Rank: 6 of 29)
Debris Cover (Based on Beason, 2017 - not updated in 2021):
0.634 ± 0.038 square miles
(1.641 ± 0.099 km2)
(Rank: 2 of 29)
Estimated Glacial Volume: (See notes below)
0.0352 cubic miles
(0.1467 km3)
Highest Elevation (Head):
14,371 feet
(4,380 m)
Lowest Elevation (Terminus):
5,347 feet
(1,630 m)
Elevation Range:
9,024 feet
(2,751 m)
Length:
3.57 miles
(5.74 km)
Average Slope:
27°
Average Flow Direction (Flows towards):
South southeast (166°)
|
|
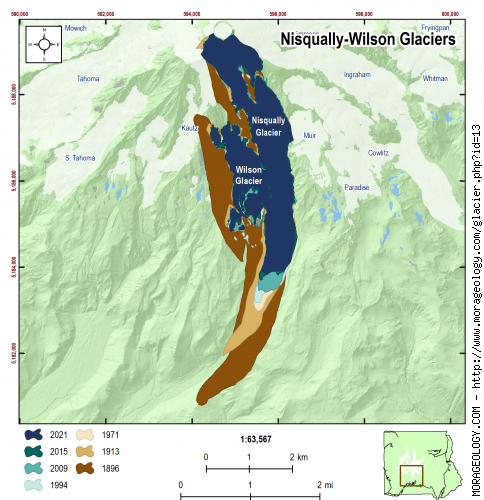
CHANGE IN EXTENT, 1896-2015 (Beason, 2017):
| Units |
1896 |
1913 |
1971 |
1994 |
2009 |
2015 |
2021 |
| Area, mi2 |
3.871 |
2.544 |
2.344 |
2.415 |
2.318 |
1.618 |
1.569 |
| Area, km2 |
10.026 |
6.588 |
6.072 |
6.254 |
6.003 |
4.192 |
4.064 |
Area change between periods
|
1913 |
1971 |
1994 |
2009 |
2015 |
2021 |
| 1896 |
-1.327 mi2
(-3.438 km2) |
-1.527 mi2
(-3.954 km2) |
-1.457 mi2
(-3.772 km2) |
-1.553 mi2
(-4.023 km2) |
-2.253 mi2
(-5.835 km2) |
-2.302 mi2
(-5.962 km2) |
| 1913 |
-- |
-0.199 mi2
(-0.516 km2) |
-0.129 mi2
(-0.334 km2) |
-0.226 mi2
(-0.585 km2) |
-0.925 mi2
(-2.397 km2) |
-0.975 mi2
(-2.524 km2) |
| 1971 |
|
-- |
0.070 mi2
(0.182 km2) |
-0.027 mi2
(-0.069 km2) |
-0.726 mi2
(-1.880 km2) |
-0.775 mi2
(-2.008 km2) |
| 1994 |
|
-- |
-0.097 mi2
(-0.251 km2) |
-0.796 mi2
(-2.062 km2) |
-0.846 mi2
(-2.190 km2) |
| 2009 |
|
-- |
-0.699 mi2
(-1.812 km2) |
-0.749 mi2
(-1.939 km2) |
| 2015 |
|
-- |
-0.049 mi2
(-0.128 km2) |
Percent change between periods
|
1913 |
1971 |
1994 |
2009 |
2015 |
2021 |
| 1896 |
-34.29 % |
-39.44 % |
-37.63 % |
-40.13 % |
-58.19 % |
-59.47 % |
| 1913 |
-- |
-7.83 % |
-5.07 % |
-8.88 % |
-36.38 % |
-38.31 % |
| 1971 |
|
-- |
2.99 % |
-1.13 % |
-30.97 % |
-33.07 % |
| 1994 |
|
-- |
-4.01 % |
-32.98 % |
-35.02 % |
| 2009 |
|
-- |
-30.18 % |
-32.30 % |
| 2015 |
|
-- |
-3.05 % |
|
ESTIMATED CHANGE IN VOLUME, 1896-2021 (Beason et al., 2022; George and Beason, 2017):
PLEASE see important notes about this, below...
| Units |
1896 |
1913 |
1971 |
1981* |
1994 |
2009 |
2015 |
2021 |
| Volume, mi3 |
0.0871 |
0.0572 |
0.0527 |
0.0530 |
0.0543 |
0.0521 |
0.0364 |
0.0352 |
| Volume, km3 |
0.3630 |
0.2385 |
0.2198 |
0.2209 |
0.2264 |
0.2174 |
0.1518 |
0.1467 |
* = 1981 was the only year that glacial volumes have been measured. See note below.
Basal Shear Stress (τ): 2,967.91 lbs/ft2
Volume change between periods
|
1913 |
1971 |
1981 |
1994 |
2009 |
2015 |
2021 |
| 1896 |
-0.0299 mi3
(-0.1245 km3) |
-0.0343 mi3
(-0.1432 km3) |
-0.0341 mi3
(-0.1421 km3) |
-0.0328 mi3
(-0.1366 km3) |
-0.0349 mi3
(-0.1457 km3) |
-0.0507 mi3
(-0.2113 km3) |
-0.0519 mi3
(-0.2164 km3) |
| 1913 |
-- |
-0.0045 mi3
(-0.0187 km3) |
-0.0042 mi3
(-0.0177 km3) |
-0.0029 mi3
(-0.0121 km3) |
-0.0051 mi3
(-0.0212 km3) |
-0.0208 mi3
(-0.0868 km3) |
-0.0220 mi3
(-0.0919 km3) |
| 1971 |
|
-- |
0.0002 mi3
(0.0010 km3) |
0.0016 mi3
(0.0066 km3) |
-0.0006 mi3
(-0.0025 km3) |
-0.0163 mi3
(-0.0681 km3) |
-0.0176 mi3
(-0.0732 km3) |
| 1981 |
|
-- |
0.0013 mi3
(0.0056 km3) |
-0.0008 mi3
(-0.0035 km3) |
-0.0166 mi3
(-0.0691 km3) |
-0.0178 mi3
(-0.0742 km3) |
| 1994 |
|
-- |
-0.0022 mi3
(-0.0091 km3) |
-0.0179 mi3
(-0.0747 km3) |
-0.0191 mi3
(-0.0798 km3) |
| 2009 |
|
-- |
-0.0157 mi3
(-0.0656 km3) |
-0.0170 mi3
(-0.0707 km3) |
| 2015 |
|
-- |
-0.0012 mi3
(-0.0051 km3) |
Percent change between periods
|
1913 |
1971 |
1981 |
1994 |
2009 |
2015 |
2021 |
| 1896 |
-34.29 % |
-39.44 % |
-39.16 % |
-37.63 % |
-40.13 % |
-58.19 % |
-59.60 % |
| 1913 |
-- |
-7.83 % |
-7.40 % |
-5.07 % |
-8.88 % |
-36.38 % |
-38.51 % |
| 1971 |
|
-- |
0.47 % |
2.99 % |
-1.13 % |
-30.97 % |
-33.29 % |
| 1981 |
|
-- |
2.52 % |
-1.59 % |
-31.29 % |
-33.60 % |
| 1994 |
|
-- |
-4.01 % |
-32.98 % |
-35.23 % |
| 2009 |
|
-- |
-30.18 % |
-32.52 % |
| 2015 |
|
-- |
-3.36 % |
With the exception of data in 1981, all values here are calculated estimates based on work by Driedger and Kennard (1986), which calculates glacier volumes with the following equations:
If Glacier Length (L) > 8,500 ft:
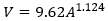
If Glacier Length (L) < 8,500 ft:
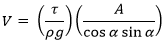
Basal shear stress (τ) is calculated as:
Where V is the calculated volume of the glacier (ft3), A is the calculated area of the glacier (ft2), ρ is the density of ice (1.779 slug/ft3), g is the acceleration of gravity (32.178 ft/s2), and α is the average slope of the glacier.
If you need a really good research project, recalculating the glacier volumes at Mount Rainier is the way to go!
|
NOTES:
Data References:
Beason et al., 2022,
Beason, 2017,
George and Beason, 2017,
Reese, 2009, and
Driedger and Kennard, 1986