Switch Glacier:
NOTE: This page has been updated to show 2021 extents and changes
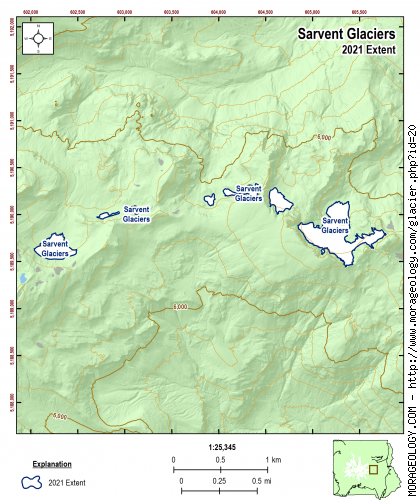
Sarvent Glaciers
The most easterly of the glaciers on the east slope east of the Meany Crest were named for Henry M. Sarvant, a surveyor and engineer, who made the first detailed map of the mountain. In 1895 Sarvent made what was called "....a comprehensive survey of the east side...." of the Mountain. At the time Sarvent was a Tacoma resident who was employed by Frederick G. Plummer, a civil Engineer who at one time was Pierce County auditor. (Reese, 2009)
|
STATISTICS AS OF 2021 (Beason et al., 2022):
Aerial Extent:
0.147 ± 0.010 square miles
(0.380 ± 0.025 km2)
(Rank: 24 of 29)
Debris Cover (Based on Beason, 2017 - not updated in 2021):
--No appreciable debris cover in 2015--
Estimated Glacial Volume: (See notes below)
0.0018 cubic miles
(0.0074 km3)
Highest Elevation (Head):
7,304 feet
(2,226 m)
Lowest Elevation (Terminus):
6,033 feet
(1,839 m)
Elevation Range:
1,271 feet
(387 m)
Length:
0.36 miles
(0.58 km)
Average Slope:
32°
Average Flow Direction (Flows towards):
North northeast (30°)
|
|
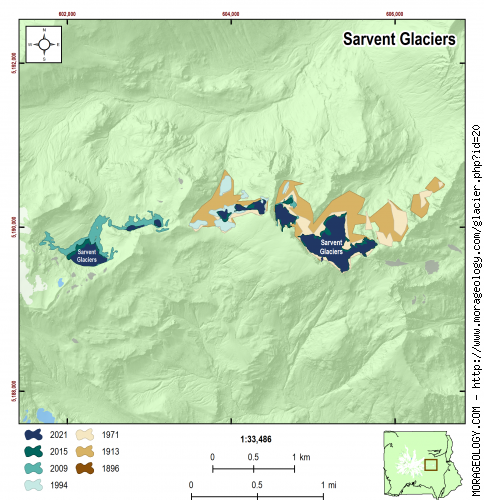
CHANGE IN EXTENT, 1896-2015 (Beason, 2017):
| Units |
1896 |
1913 |
1971 |
1994 |
2009 |
2015 |
2021 |
| Area, mi2 |
-- |
0.443 |
0.265 |
0.056 |
0.268 |
0.176 |
0.147 |
| Area, km2 |
-- |
1.148 |
0.686 |
0.146 |
0.695 |
0.455 |
0.380 |
Area change between periods
|
1913 |
1971 |
1994 |
2009 |
2015 |
2021 |
| 1896 |
0.443 mi2
(1.149 km2) |
0.265 mi2
(0.687 km2) |
0.057 mi2
(0.147 km2) |
0.269 mi2
(0.696 km2) |
0.176 mi2
(0.456 km2) |
0.147 mi2
(0.381 km2) |
| 1913 |
-- |
-0.178 mi2
(-0.461 km2) |
-0.387 mi2
(-1.002 km2) |
-0.175 mi2
(-0.453 km2) |
-0.268 mi2
(-0.693 km2) |
-0.296 mi2
(-0.767 km2) |
| 1971 |
|
-- |
-0.209 mi2
(-0.541 km2) |
0.003 mi2
(0.009 km2) |
-0.089 mi2
(-0.232 km2) |
-0.118 mi2
(-0.306 km2) |
| 1994 |
|
-- |
0.212 mi2
(0.549 km2) |
0.119 mi2
(0.309 km2) |
0.091 mi2
(0.235 km2) |
| 2009 |
|
-- |
-0.093 mi2
(-0.240 km2) |
-0.121 mi2
(-0.314 km2) |
| 2015 |
|
-- |
-0.029 mi2
(-0.074 km2) |
Percent change between periods
|
1913 |
1971 |
1994 |
2009 |
2015 |
2021 |
| 1896 |
-114,736.25 % |
-68,649.82 % |
-14,652.82 % |
-69,518.63 % |
-45,520.48 % |
-38,104.46 % |
| 1913 |
-- |
-40.20 % |
-87.31 % |
-39.44 % |
-60.38 % |
-66.85 % |
| 1971 |
|
-- |
-78.77 % |
1.27 % |
-33.74 % |
-44.56 % |
| 1994 |
|
-- |
377.01 % |
212.11 % |
161.15 % |
| 2009 |
|
-- |
-34.57 % |
-45.25 % |
| 2015 |
|
-- |
-16.33 % |
|
ESTIMATED CHANGE IN VOLUME, 1896-2021 (Beason et al., 2022; George and Beason, 2017):
PLEASE see important notes about this, below...
| Units |
1896 |
1913 |
1971 |
1981* |
1994 |
2009 |
2015 |
2021 |
| Volume, mi3 |
-- |
0.0061 |
0.0034 |
0.0027 |
0.0006 |
0.0035 |
0.0022 |
0.0018 |
| Volume, km3 |
-- |
0.0255 |
0.0143 |
0.0113 |
0.0025 |
0.0145 |
0.0090 |
0.0074 |
* = 1981 was the only year that glacial volumes have been measured. See note below.
Basal Shear Stress (τ): 2,333.98 lbs/ft2
Volume change between periods
|
1913 |
1971 |
1981 |
1994 |
2009 |
2015 |
2021 |
| 1896 |
0.0061 mi3
(0.0255 km3) |
0.0034 mi3
(0.0143 km3) |
0.0027 mi3
(0.0113 km3) |
0.0006 mi3
(0.0025 km3) |
0.0035 mi3
(0.0145 km3) |
0.0022 mi3
(0.0090 km3) |
0.0018 mi3
(0.0074 km3) |
| 1913 |
-- |
-0.0027 mi3
(-0.0112 km3) |
-0.0034 mi3
(-0.0142 km3) |
-0.0055 mi3
(-0.0230 km3) |
-0.0026 mi3
(-0.0110 km3) |
-0.0040 mi3
(-0.0165 km3) |
-0.0043 mi3
(-0.0181 km3) |
| 1971 |
|
-- |
-0.0007 mi3
(-0.0030 km3) |
-0.0028 mi3
(-0.0118 km3) |
0.0000 mi3
(0.0002 km3) |
-0.0013 mi3
(-0.0053 km3) |
-0.0017 mi3
(-0.0069 km3) |
| 1981 |
|
-- |
-0.0021 mi3
(-0.0088 km3) |
0.0008 mi3
(0.0032 km3) |
-0.0006 mi3
(-0.0023 km3) |
-0.0009 mi3
(-0.0040 km3) |
| 1994 |
|
-- |
0.0029 mi3
(0.0120 km3) |
0.0016 mi3
(0.0065 km3) |
0.0012 mi3
(0.0049 km3) |
| 2009 |
|
-- |
-0.0013 mi3
(-0.0055 km3) |
-0.0017 mi3
(-0.0071 km3) |
| 2015 |
|
-- |
-0.0004 mi3
(-0.0016 km3) |
Percent change between periods
|
1913 |
1971 |
1981 |
1994 |
2009 |
2015 |
2021 |
| 1896 |
-2,548,790.86 % |
-1,430,015.52 % |
-1,132,772.00 % |
-250,590.85 % |
-1,450,401.76 % |
-900,405.85 % |
-736,945.59 % |
| 1913 |
-- |
-43.90 % |
-55.56 % |
-90.17 % |
-43.10 % |
-64.68 % |
-71.09 % |
| 1971 |
|
-- |
-20.79 % |
-82.48 % |
1.43 % |
-37.04 % |
-48.47 % |
| 1981 |
|
-- |
-77.88 % |
28.04 % |
-20.51 % |
-34.95 % |
| 1994 |
|
-- |
478.98 % |
259.42 % |
194.16 % |
| 2009 |
|
-- |
-37.92 % |
-49.19 % |
| 2015 |
|
-- |
-18.16 % |
With the exception of data in 1981, all values here are calculated estimates based on work by Driedger and Kennard (1986), which calculates glacier volumes with the following equations:
If Glacier Length (L) > 8,500 ft:
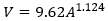
If Glacier Length (L) < 8,500 ft:
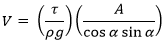
Basal shear stress (τ) is calculated as:
Where V is the calculated volume of the glacier (ft3), A is the calculated area of the glacier (ft2), ρ is the density of ice (1.779 slug/ft3), g is the acceleration of gravity (32.178 ft/s2), and α is the average slope of the glacier.
If you need a really good research project, recalculating the glacier volumes at Mount Rainier is the way to go!
|
NOTES:
Area was not measured for this glacier in 1896
Data References:
Beason et al., 2022,
Beason, 2017,
George and Beason, 2017,
Reese, 2009, and
Driedger and Kennard, 1986