NOTE: The data shown here is based on the 2021 glacier update at Mount Rainier, and should be considered the most up-to-date data on glaciers at the park (2023-04-06).
2021 Glacier Area and Volume Update
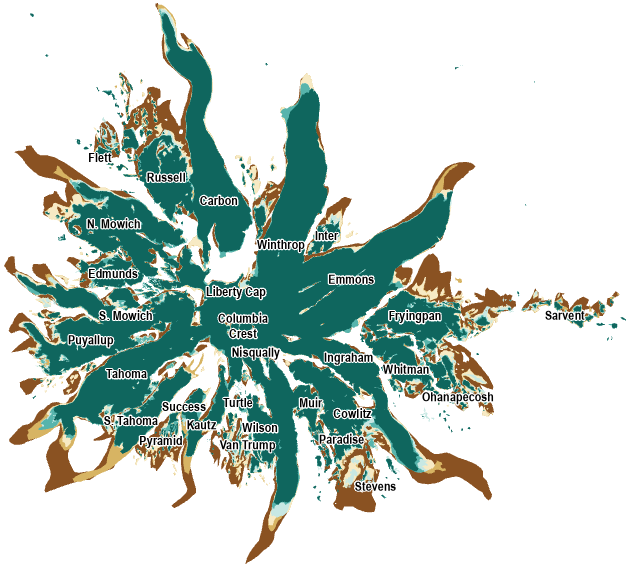
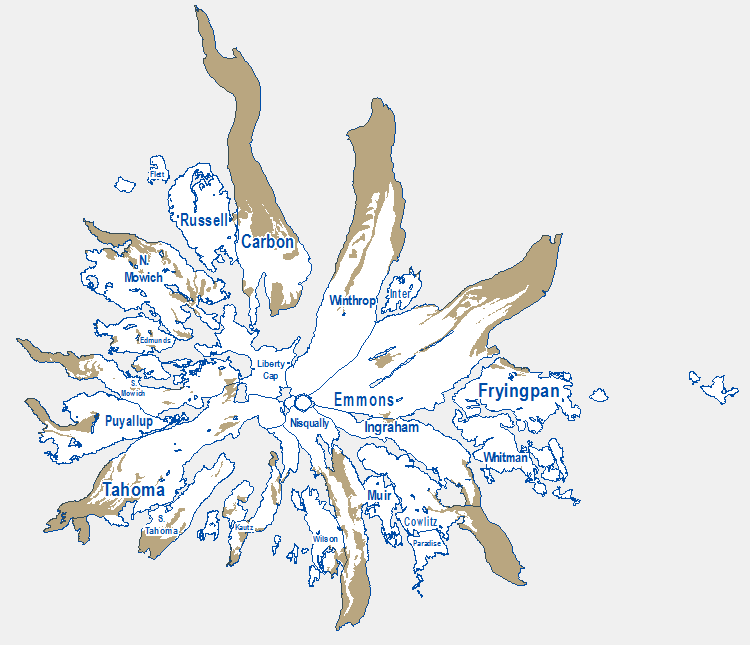
Mount Rainier is the most glaciated volcano in the Cascade Range of the western United States and has more glacial ice on its edifice than all other volcanoes in the Cascade Range combined. Measuring rates of glacial ice loss during warming climates are critical to understanding the future impacts to riparian areas downslope of the glaciers, sediment production to braided rivers, aquatic impacts due to increasing stream temperatures, and many other important areas for park resource management. Glacial area has been delineated many times in the last century; most importantly in 1896, 1913, 1971, 1994, 2009, and, most recently, in 2015. Each of these extents represents a snapshot of the surface area of the volcano occupied by glacial ice during those years and provides an opportunity to visualize the health of the glaciers in the park over time.
Using aerially derived Structure from Motion (SfM) data acquired in September 2021, as well as other satellite and aerial imagery, glacier area for each of the 29 named glacial features is updated for Mount Rainier and presented here. From these source data, we have mapped not only the extent of ice but estimate the volume of ice from methods developed by other researchers in the past. Overall, our data shows a continuation of gradual yet accelerating loss of glacial ice at Mount Rainier, resulting in significant changes in regional ice volume over the last century. Regional climate change is affecting all glacial features at Mount Rainier, but mostly those smaller cirque glaciers and discontinuous glaciers on the south aspect of the volcano.
This page has been provided as quick reference for the latest glacial extent and volume respository for Mount Rainier as of the 2021 delineation. Links are provided to the following: (1) Some key conclusions from the 2021 study; (2) The poster presented at the 2022 Geological Society of America Annual Meeting in Denver, Colorado; (3) A Natural Resource Report (NRR) detailing the 2021 delineation effort; (4) Overall glacial extent and volume estimates; (5) Change in glacial area and volume between 2015 and 2016; and (6) Links to detailed information on individual glaciers.
Key Conclusions from the 2021 Study
- As of 2021, Mount Rainier has 28 named glaciers (a decrease of one from 2015).
-
Analysis of changes in glacier extent and volume at Mount Rainier continues to show an overall loss of glacial ice and perennial snowfields over the last 125 years:
- Extent: -53.812 km2 (-20.777 mi2), a reduction of 41.62% in area between 1896 and 2021.
- Volume: -3.742 km3 (-0.898 mi3), a reduction of 51.56% in volume between 1896 and 2021.
-
The rate in glacier extent loss in the last 6-year period is accelerating while glacier volume is remaining about the same over the last 125-years.
-
Average rates of area loss:
- -0.430 km2/yr (-0.166 mi2/yr) between 1896 and 2021 (125 years).
- -0.544 km2/yr (-0.210 mi2/yr) between 2015 and 2021 (6 years).
-
Average rates of volume loss:
- -0.030 km3/yr (-0.007 mi3/yr) between 1896 and 2021 (125 years).
- -0.029 km3/yr (-0.007 mi3/yr) between 2015 and 2021 (6 years).
- Unabated regional climate warming will continue to result in loss of glacial area and volume.
- Several smaller, lower-elevation (cirque) glaciers have been lost in the last few decades. This survey has officially removed the Stevens Glacier from the park's inventory. Several features including the Flett, Inter, Pyramid, Sarvent, and Van Trump Glaciers are in a critical state.
- The loss of glacial ice at Mount Rainier will have severe negative implications for the health of aquatic organisms, freshwater usage, dam operations, and geologic hazards in the region.
Publications
There are two publications that are developed through this study:
-
POSTER:
Beason, S.R., T.R. Kenyon, R.P. Jost, and L.J. Walker, 2022, A vanishing landscape: Current trends for the glaciers of Mount Rainier National Park, Washington, USA: Poster 23-9, Geological Society of America Abstracts with Programs, Vol. 54, No. 5, doi: 10.1130/abs/2022AM-381984.
-
NATURAL RESOURCE REPORT:
Beason, S.R., T.R. Kenyon, R.P. Jost, and L.J. Walker, 2023, Changes in glacial extents and estimated changes in glacial volume at Mount Rainier National Park, Washington, USA from 1896 to 2021: National Park Service Natural Resource Report NPS/MORA/NRR—2022/2524, National Park Service, Fort Collins, CO, 63 pages, doi: 10.36967/2299328.
In Development - Check back in a few months... when the document is completed, it will be posted here.
Overall Glacial Extent and Volume Estimates (as of 2021)
| Glacier |
Aspect (text) |
Aspect (°) |
Slope (°) |
Length (mi) |
Length (km) |
Max Elevation (ft) |
Max Elevation (m) |
Min Elevation (ft) |
Min Elevation (m) |
Area (mi2) |
Area (km2) |
Volume (mi3) |
Volume (km3) |
| Carbon |
North |
353 |
20.22 |
5.02 |
8.08 |
12,212 |
3,722 |
3,617 |
1,102 |
2.752 |
7.127 |
0.1180 |
0.4919 |
| Columbia Crest |
East |
96 |
9.99 |
0.43 |
0.68 |
14,393 |
4,387 |
14,146 |
4,312 |
0.067 |
0.172 |
0.0006 |
0.0024 |
| Cowlitz |
East southeast |
121 |
23.18 |
3.48 |
5.59 |
11,137 |
3,395 |
5,232 |
1,595 |
1.423 |
3.685 |
0.0406 |
0.1693 |
| Edmunds |
West northwest |
287 |
23.58 |
1.27 |
2.04 |
10,105 |
3,080 |
6,958 |
2,121 |
0.450 |
1.165 |
0.0067 |
0.0279 |
| Emmons |
Northeast |
55 |
23.77 |
4.55 |
7.32 |
14,148 |
4,312 |
4,883 |
1,488 |
4.231 |
10.959 |
0.1582 |
0.6592 |
| Flett |
North |
356 |
20.18 |
0.41 |
0.66 |
7,951 |
2,423 |
7,120 |
2,170 |
0.140 |
0.363 |
0.0017 |
0.0069 |
| Fryingpan |
Northeast |
38 |
21.75 |
0.98 |
1.59 |
9,930 |
3,027 |
7,093 |
2,162 |
1.156 |
2.993 |
0.0223 |
0.0930 |
| Ingraham |
East southeast |
120 |
25.17 |
3.22 |
5.18 |
14,064 |
4,287 |
6,493 |
1,979 |
1.144 |
2.962 |
0.0294 |
0.1224 |
| Inter |
North northeast |
25 |
25.83 |
0.92 |
1.48 |
9,627 |
2,934 |
7,376 |
2,248 |
0.206 |
0.532 |
0.0025 |
0.0104 |
| Kautz |
South southwest |
193 |
29.39 |
2.59 |
4.17 |
14,131 |
4,307 |
6,917 |
2,108 |
0.603 |
1.561 |
0.0123 |
0.0513 |
| Liberty Cap |
Southwest |
233 |
28.82 |
1.69 |
2.71 |
14,088 |
4,294 |
10,565 |
3,220 |
0.801 |
2.076 |
0.0200 |
0.0833 |
| Muir |
South |
183 |
17.70 |
1.18 |
1.89 |
10,077 |
3,071 |
8,219 |
2,505 |
0.318 |
0.823 |
0.0043 |
0.0180 |
| Nisqually |
South southeast |
166 |
27.00 |
3.57 |
5.74 |
14,371 |
4,380 |
5,347 |
1,630 |
1.584 |
4.102 |
0.0434 |
0.1808 |
| N. Mowich |
Northwest |
322 |
25.23 |
2.56 |
4.12 |
12,189 |
3,715 |
5,429 |
1,655 |
1.895 |
4.907 |
0.0502 |
0.2091 |
| Ohanapecosh |
East northeast |
72 |
21.24 |
0.49 |
0.79 |
8,392 |
2,558 |
7,250 |
2,210 |
0.238 |
0.616 |
0.0028 |
0.0115 |
| Paradise |
East southeast |
124 |
24.07 |
0.41 |
0.65 |
8,425 |
2,568 |
6,850 |
2,088 |
0.224 |
0.581 |
0.0027 |
0.0114 |
| Puyallup |
West |
280 |
19.53 |
2.47 |
3.98 |
9,600 |
2,926 |
5,506 |
1,678 |
1.196 |
3.098 |
0.0317 |
0.1323 |
| Pyramid |
South |
185 |
22.73 |
0.59 |
0.95 |
8,881 |
2,707 |
7,673 |
2,339 |
0.068 |
0.176 |
0.0006 |
0.0024 |
| Russell |
North northeast |
28 |
22.03 |
1.70 |
2.74 |
9,675 |
2,949 |
6,663 |
2,031 |
1.045 |
2.706 |
0.0199 |
0.0828 |
| Sarvent |
North northeast |
30 |
32.11 |
0.36 |
0.58 |
7,304 |
2,226 |
6,033 |
1,839 |
0.147 |
0.380 |
0.0016 |
0.0066 |
| S. Mowich |
West |
272 |
26.08 |
3.78 |
6.08 |
12,839 |
3,913 |
4,897 |
1,493 |
1.400 |
3.626 |
0.0333 |
0.1387 |
| S. Tahoma |
Southwest |
219 |
23.90 |
2.00 |
3.22 |
10,811 |
3,295 |
6,625 |
2,019 |
0.752 |
1.947 |
0.0169 |
0.0706 |
| Stevens |
East southeast |
123 |
19.98 |
0.05 |
0.09 |
6,812 |
2,076 |
6,629 |
2,021 |
0.000 |
-0.001 |
0.0000 |
0.0000 |
| Success |
South |
184 |
28.93 |
0.74 |
1.19 |
10,625 |
3,239 |
8,477 |
2,584 |
0.153 |
0.396 |
0.0017 |
0.0069 |
| Tahoma |
West southwest |
243 |
24.45 |
4.00 |
6.44 |
14,334 |
4,369 |
5,510 |
1,679 |
2.484 |
6.433 |
0.0750 |
0.3125 |
| Van Trump |
South southeast |
168 |
27.75 |
0.30 |
0.48 |
8,602 |
2,622 |
7,540 |
2,298 |
0.045 |
0.117 |
0.0003 |
0.0014 |
| Whitman |
Southeast |
142 |
16.40 |
2.02 |
3.25 |
10,286 |
3,135 |
7,579 |
2,310 |
0.713 |
1.846 |
0.0187 |
0.0779 |
| Wilson |
Southeast |
142 |
25.65 |
1.31 |
2.11 |
10,801 |
3,292 |
6,735 |
2,053 |
0.564 |
1.459 |
0.0117 |
0.0487 |
| Winthrop |
North northeast |
20 |
24.48 |
4.86 |
7.83 |
14,305 |
4,360 |
4,852 |
1,479 |
3.354 |
8.688 |
0.1167 |
0.4865 |
| Minimum |
-- |
-- |
9.99 |
0.05 |
0.09 |
6,812 |
2,076 |
3,617 |
1,102 |
0.000 |
-0.001 |
0.0000 |
0.0000 |
| Average |
-- |
-- |
23.49 |
1.96 |
3.16 |
11,038 |
3,365 |
6,835 |
2,083 |
1.005 |
2.603 |
0.0291 |
0.1212 |
| Maximum |
-- |
-- |
32.11 |
5.02 |
8.08 |
14,393 |
4,387 |
14,146 |
4,312 |
4.231 |
10.959 |
0.1582 |
0.6592 |
| Total |
-- |
-- |
-- |
-- |
-- |
-- |
-- |
-- |
-- |
29.149 |
75.495 |
0.8436 |
3.5162 |
Change in Glacial Extent and Volume between 2015 and 2021 (6 years)
| Glacier |
Area, 2015, km2
| Area, 2021, km2
| Area, % Loss |
Volume, 2015, km3
| Volume, 2021, km3
| Volume, % Loss |
North or South Facing |
Summit or Cirque |
| Carbon |
7.257 |
7.127 |
-1.785 |
0.5042 |
0.4919 |
-2.436 |
North |
C |
| Columbia Crest |
0.180 |
0.172 |
-4.489 |
0.0025 |
0.0024 |
-6.087 |
South |
S |
| Cowlitz |
3.990 |
3.685 |
-7.661 |
0.1888 |
0.1693 |
-10.333 |
South |
C |
| Edmunds |
1.252 |
1.165 |
-7.013 |
0.0308 |
0.0279 |
-9.459 |
North |
C |
| Emmons |
11.027 |
10.959 |
-0.615 |
0.6648 |
0.6592 |
-0.841 |
North |
S |
| Flett |
0.406 |
0.363 |
-10.529 |
0.0081 |
0.0069 |
-14.118 |
North |
C |
| Fryingpan |
3.245 |
2.993 |
-7.744 |
0.1038 |
0.0930 |
-10.425 |
North |
C |
| Ingraham |
3.007 |
2.962 |
-1.494 |
0.1249 |
0.1224 |
-2.038 |
South |
S |
| Inter |
0.574 |
0.532 |
-7.231 |
0.0116 |
0.0104 |
-9.754 |
North |
C |
| Kautz |
1.611 |
1.561 |
-3.105 |
0.0536 |
0.0513 |
-4.224 |
South |
S |
| Liberty Cap |
2.139 |
2.076 |
-2.950 |
0.0868 |
0.0833 |
-4.016 |
North |
S |
| Muir |
0.875 |
0.823 |
-6.017 |
0.0196 |
0.0180 |
-8.132 |
South |
C |
| Nisqually |
4.192 |
4.102 |
-2.132 |
0.1862 |
0.1808 |
-2.905 |
South |
S |
| N. Mowich |
5.144 |
4.907 |
-4.614 |
0.2231 |
0.2091 |
-6.253 |
North |
C |
| Ohanapecosh |
0.669 |
0.616 |
-7.969 |
0.0129 |
0.0115 |
-10.727 |
South |
C |
| Paradise |
0.612 |
0.581 |
-5.107 |
0.0122 |
0.0114 |
-6.915 |
South |
C |
| Puyallup |
3.258 |
3.098 |
-4.919 |
0.1417 |
0.1323 |
-6.669 |
South |
C |
| Pyramid |
0.262 |
0.176 |
-32.869 |
0.0042 |
0.0024 |
-42.016 |
South |
C |
| Russell |
2.892 |
2.706 |
-6.454 |
0.0907 |
0.0828 |
-8.710 |
North |
C |
| Sarvent |
0.455 |
0.380 |
-16.327 |
0.0085 |
0.0066 |
-21.629 |
North |
C |
| S. Mowich |
3.766 |
3.626 |
-3.699 |
0.1460 |
0.1387 |
-5.022 |
South |
C |
| S. Tahoma |
2.002 |
1.947 |
-2.738 |
0.0733 |
0.0706 |
-3.728 |
South |
C |
| Stevens |
0.033 |
-0.001 |
-103.015 |
0.0002 |
0.0000 |
-100.441 |
South |
C |
| Success |
0.470 |
0.396 |
-15.689 |
0.0088 |
0.0069 |
-20.810 |
South |
C |
| Tahoma |
6.787 |
6.433 |
-5.218 |
0.3362 |
0.3125 |
-7.065 |
South |
S |
| Van Trump |
0.176 |
0.117 |
-33.578 |
0.0024 |
0.0014 |
-42.853 |
South |
C |
| Whitman |
1.939 |
1.846 |
-4.798 |
0.0834 |
0.0779 |
-6.512 |
South |
C |
| Wilson |
1.562 |
1.459 |
-6.586 |
0.0535 |
0.0487 |
-8.902 |
South |
C |
| Winthrop |
8.977 |
8.688 |
-3.215 |
0.5087 |
0.4865 |
-4.370 |
North |
S |
Some Interpretations of this data (Averages of the percentages):
- South facing glaciers lost about 2.24x the extent of north facing glaciers (North: -6.23%, South: -13.95%)
- South facing glaciers lost about 1.96x the volume of north facing glaciers (North: -8.36%, South: -16.41%)
- Glaciers that start lower on the mountain lost about 4.86x as much extent as those that start near or on the summit (Summit: -2.90%, Cirque: -14.11%)
- Glaciers that start lower on the mountain lost about 4.30x as much volume as those that start near or on the summit (Summit: -3.94%, Cirque: -16.94%)
-
Details:
-
Extent:
- North-Facing Summit: -2.26%
- South-Facing Summit: -3.29%
- North-Facing Cirque: -7.71%
- South-Facing Cirque: -18.05%
-
Volume:
- North-Facing Summit: -3.08%
- South-Facing Summit: -4.46%
- North-Facing Cirque: -10.35%
- South-Facing Cirque: -21.00%
Detailed Information on Individual Glaciers
 Choose a Glacier:
References
Choose a Glacier:
References
- Beason, S.R., 2017, Change in glacial extent at Mount Rainier National Park from 1896-2015: Natural Resource Report NPS/MORA/NRR-2017/1472, National Park Service, 98 p.
- Beason, S.R., T.R. Kenyon, R.P. Jost, and L.J. Walker, 2022, A vanishing landscape: Current trends for the glaciers of Mount Rainier National Park, Washington, USA: Poster 23-9, Geological Society of America Abstracts with Programs, Vol. 54, No. 5, doi: 10.1130/abs/2022AM-381984.
- George, J.L. and S.R. Beason, 2017, Dramatic changes to glacial volume and extent since the late 19th century at Mount Rainier National Park, Washington, USA: Poster #158-6, Geological Society of America Abstracts with Programs, Vol. 49, No. 6, doi: 10.1130/abs/2017AM-299694.
- Driedger, C.L. and P.M. Kennard, 1986, Ice volumes on Cascade Volcanoes: Mount Rainier, Mount Hood, Three Sisters, and Mount Shasta: Professional Paper 1365, United States Geological Survey, 38 p.
- Nylen, T.H., 2004, Spatial and temporal variations of glaciers (1913-1994) on Mt. Rainier and the relation with climate: M.S. Thesis, Portland State University, 128 p.