Switch Glacier:
NOTE: This page has been updated to show 2021 extents and changes
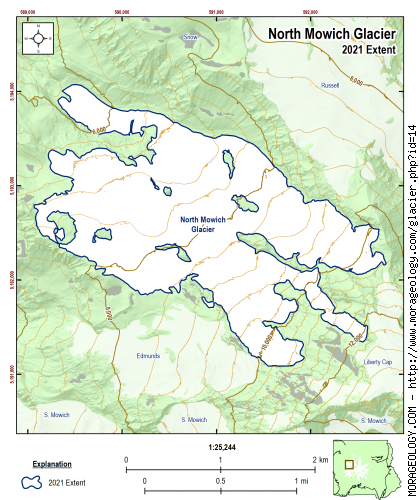
North Mowich Glacier
This large glacier on the northwest side of Mount Rainier is separated from the Flett and Russell Glaciers by Ptarmigan Ridge on the northeast and is connected to the Edmonds Glacier on the south. It gives rise to the North Mowich River and was once called the Willis Glacier because it is below Willis Wall. Mowich is a Chinook jargon term for "deer"or "animal." (Reese, 2009)
|
STATISTICS AS OF 2021 (Beason et al., 2022):
Aerial Extent:
1.901 ± 0.102 square miles
(4.923 ± 0.265 km2)
(Rank: 5 of 29)
Debris Cover (Based on Beason, 2017 - not updated in 2021):
0.430 ± 0.027 square miles
(1.114 ± 0.069 km2)
(Rank: 3 of 29)
Estimated Glacial Volume: (See notes below)
0.0459 cubic miles
(0.1913 km3)
Highest Elevation (Head):
12,189 feet
(3,715 m)
Lowest Elevation (Terminus):
5,429 feet
(1,655 m)
Elevation Range:
6,760 feet
(2,060 m)
Length:
2.56 miles
(4.12 km)
Average Slope:
25°
Average Flow Direction (Flows towards):
Northwest (322°)
|
|
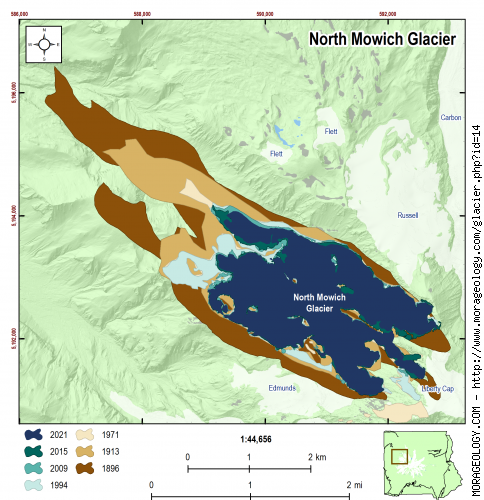
CHANGE IN EXTENT, 1896-2015 (Beason, 2017):
| Units |
1896 |
1913 |
1971 |
1994 |
2009 |
2015 |
2021 |
| Area, mi2 |
4.276 |
3.101 |
2.417 |
2.358 |
2.010 |
1.986 |
1.901 |
| Area, km2 |
11.074 |
8.032 |
6.261 |
6.108 |
5.207 |
5.144 |
4.923 |
Area change between periods
|
1913 |
1971 |
1994 |
2009 |
2015 |
2021 |
| 1896 |
-1.174 mi2
(-3.042 km2) |
-1.858 mi2
(-4.813 km2) |
-1.917 mi2
(-4.966 km2) |
-2.266 mi2
(-5.868 km2) |
-2.290 mi2
(-5.930 km2) |
-2.375 mi2
(-6.151 km2) |
| 1913 |
-- |
-0.684 mi2
(-1.772 km2) |
-0.743 mi2
(-1.924 km2) |
-1.091 mi2
(-2.826 km2) |
-1.115 mi2
(-2.888 km2) |
-1.200 mi2
(-3.109 km2) |
| 1971 |
|
-- |
-0.059 mi2
(-0.153 km2) |
-0.407 mi2
(-1.054 km2) |
-0.431 mi2
(-1.117 km2) |
-0.516 mi2
(-1.338 km2) |
| 1994 |
|
-- |
-0.348 mi2
(-0.902 km2) |
-0.372 mi2
(-0.964 km2) |
-0.458 mi2
(-1.185 km2) |
| 2009 |
|
-- |
-0.024 mi2
(-0.062 km2) |
-0.109 mi2
(-0.283 km2) |
| 2015 |
|
-- |
-0.085 mi2
(-0.221 km2) |
Percent change between periods
|
1913 |
1971 |
1994 |
2009 |
2015 |
2021 |
| 1896 |
-27.47 % |
-43.46 % |
-44.84 % |
-52.98 % |
-53.55 % |
-55.54 % |
| 1913 |
-- |
-22.05 % |
-23.96 % |
-35.18 % |
-35.96 % |
-38.71 % |
| 1971 |
|
-- |
-2.44 % |
-16.84 % |
-17.83 % |
-21.37 % |
| 1994 |
|
-- |
-14.76 % |
-15.78 % |
-19.40 % |
| 2009 |
|
-- |
-1.20 % |
-5.44 % |
| 2015 |
|
-- |
-4.30 % |
|
ESTIMATED CHANGE IN VOLUME, 1896-2021 (Beason et al., 2022; George and Beason, 2017):
PLEASE see important notes about this, below...
| Units |
1896 |
1913 |
1971 |
1981* |
1994 |
2009 |
2015 |
2021 |
| Volume, mi3 |
0.1037 |
0.0752 |
0.0586 |
0.0645 |
0.0572 |
0.0488 |
0.0482 |
0.0459 |
| Volume, km3 |
0.4322 |
0.3135 |
0.2444 |
0.2690 |
0.2384 |
0.2032 |
0.2008 |
0.1913 |
* = 1981 was the only year that glacial volumes have been measured. See note below.
Basal Shear Stress (τ): 3,025.01 lbs/ft2
Volume change between periods
|
1913 |
1971 |
1981 |
1994 |
2009 |
2015 |
2021 |
| 1896 |
-0.0285 mi3
(-0.1187 km3) |
-0.0451 mi3
(-0.1879 km3) |
-0.0392 mi3
(-0.1632 km3) |
-0.0465 mi3
(-0.1938 km3) |
-0.0549 mi3
(-0.2290 km3) |
-0.0555 mi3
(-0.2315 km3) |
-0.0578 mi3
(-0.2410 km3) |
| 1913 |
-- |
-0.0166 mi3
(-0.0691 km3) |
-0.0107 mi3
(-0.0445 km3) |
-0.0180 mi3
(-0.0751 km3) |
-0.0265 mi3
(-0.1103 km3) |
-0.0270 mi3
(-0.1127 km3) |
-0.0293 mi3
(-0.1222 km3) |
| 1971 |
|
-- |
0.0059 mi3
(0.0246 km3) |
-0.0014 mi3
(-0.0060 km3) |
-0.0099 mi3
(-0.0412 km3) |
-0.0105 mi3
(-0.0436 km3) |
-0.0127 mi3
(-0.0531 km3) |
| 1981 |
|
-- |
-0.0073 mi3
(-0.0306 km3) |
-0.0158 mi3
(-0.0658 km3) |
-0.0164 mi3
(-0.0682 km3) |
-0.0187 mi3
(-0.0777 km3) |
| 1994 |
|
-- |
-0.0084 mi3
(-0.0352 km3) |
-0.0090 mi3
(-0.0376 km3) |
-0.0113 mi3
(-0.0471 km3) |
| 2009 |
|
-- |
-0.0006 mi3
(-0.0024 km3) |
-0.0029 mi3
(-0.0120 km3) |
| 2015 |
|
-- |
-0.0023 mi3
(-0.0095 km3) |
Percent change between periods
|
1913 |
1971 |
1981 |
1994 |
2009 |
2015 |
2021 |
| 1896 |
-27.47 % |
-43.46 % |
-37.76 % |
-44.84 % |
-52.98 % |
-53.55 % |
-55.75 % |
| 1913 |
-- |
-22.05 % |
-14.20 % |
-23.96 % |
-35.18 % |
-35.96 % |
-38.99 % |
| 1971 |
|
-- |
10.08 % |
-2.44 % |
-16.84 % |
-17.83 % |
-21.73 % |
| 1981 |
|
-- |
-11.38 % |
-24.46 % |
-25.36 % |
-28.90 % |
| 1994 |
|
-- |
-14.76 % |
-15.78 % |
-19.77 % |
| 2009 |
|
-- |
-1.20 % |
-5.88 % |
| 2015 |
|
-- |
-4.74 % |
With the exception of data in 1981, all values here are calculated estimates based on work by Driedger and Kennard (1986), which calculates glacier volumes with the following equations:
If Glacier Length (L) > 8,500 ft:
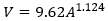
If Glacier Length (L) < 8,500 ft:
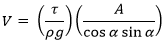
Basal shear stress (τ) is calculated as:
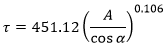
Where V is the calculated volume of the glacier (ft3), A is the calculated area of the glacier (ft2), ρ is the density of ice (1.779 slug/ft3), g is the acceleration of gravity (32.178 ft/s2), and α is the average slope of the glacier.
If you need a really good research project, recalculating the glacier volumes at Mount Rainier is the way to go!
|
NOTES:
Data References:
Beason et al., 2022,
Beason, 2017,
George and Beason, 2017,
Reese, 2009, and
Driedger and Kennard, 1986