Switch Glacier:
NOTE: This page has been updated to show 2021 extents and changes
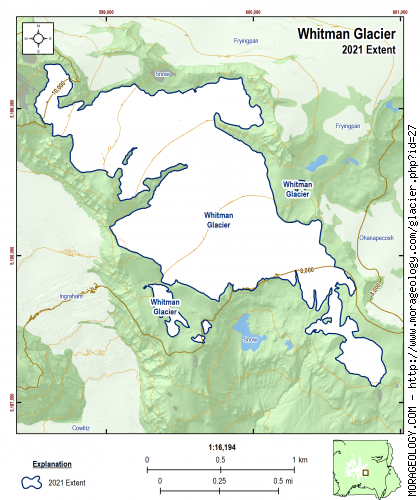
Whitman Glacier
This glacier on the east side of Mount Rainier was named for Marcus Whitman, the missionary. He was born in Rushville, New York, on September 4, 1802, received medical training and in 1835 made a missionary reconnaissance to Oregon. He married Narcissa Prentiss and with others made the first journey on the Oregon Trail by women. He and his family were killed by Cayuse Indians on November 29, 1847. (Reese, 2009)
|
STATISTICS AS OF 2021 (Beason et al., 2022):
Aerial Extent:
0.710 ± 0.040 square miles
(1.840 ± 0.103 km2)
(Rank: 15 of 29)
Debris Cover (Based on Beason, 2017 - not updated in 2021):
0.001 ± 0.000 square miles
(0.001 ± 0.001 km2)
(Rank: 3 of 29)
Estimated Glacial Volume: (See notes below)
0.0221 cubic miles
(0.0920 km3)
Highest Elevation (Head):
10,286 feet
(3,135 m)
Lowest Elevation (Terminus):
7,579 feet
(2,310 m)
Elevation Range:
2,707 feet
(825 m)
Length:
2.02 miles
(3.25 km)
Average Slope:
16°
Average Flow Direction (Flows towards):
Southeast (142°)
|
|
CHANGE IN EXTENT, 1896-2015 (Beason, 2017):
| Units |
1896 |
1913 |
1971 |
1994 |
2009 |
2015 |
2021 |
| Area, mi2 |
0.762 |
0.939 |
0.859 |
0.894 |
0.811 |
0.749 |
0.710 |
| Area, km2 |
1.974 |
2.432 |
2.226 |
2.315 |
2.101 |
1.939 |
1.840 |
Area change between periods
|
1913 |
1971 |
1994 |
2009 |
2015 |
2021 |
| 1896 |
0.177 mi2
(0.458 km2) |
0.097 mi2
(0.251 km2) |
0.132 mi2
(0.341 km2) |
0.049 mi2
(0.127 km2) |
-0.014 mi2
(-0.036 km2) |
-0.052 mi2
(-0.135 km2) |
| 1913 |
-- |
-0.080 mi2
(-0.207 km2) |
-0.045 mi2
(-0.117 km2) |
-0.128 mi2
(-0.331 km2) |
-0.190 mi2
(-0.493 km2) |
-0.229 mi2
(-0.592 km2) |
| 1971 |
|
-- |
0.035 mi2
(0.089 km2) |
-0.048 mi2
(-0.124 km2) |
-0.111 mi2
(-0.287 km2) |
-0.149 mi2
(-0.386 km2) |
| 1994 |
|
-- |
-0.082 mi2
(-0.214 km2) |
-0.145 mi2
(-0.376 km2) |
-0.183 mi2
(-0.475 km2) |
| 2009 |
|
-- |
-0.063 mi2
(-0.163 km2) |
-0.101 mi2
(-0.262 km2) |
| 2015 |
|
-- |
-0.038 mi2
(-0.099 km2) |
Percent change between periods
|
1913 |
1971 |
1994 |
2009 |
2015 |
2021 |
| 1896 |
23.18 % |
12.72 % |
17.25 % |
6.43 % |
-1.81 % |
-6.82 % |
| 1913 |
-- |
-8.49 % |
-4.81 % |
-13.60 % |
-20.28 % |
-24.35 % |
| 1971 |
|
-- |
4.02 % |
-5.58 % |
-12.89 % |
-17.33 % |
| 1994 |
|
-- |
-9.23 % |
-16.25 % |
-20.53 % |
| 2009 |
|
-- |
-7.74 % |
-12.45 % |
| 2015 |
|
-- |
-5.10 % |
|
ESTIMATED CHANGE IN VOLUME, 1896-2021 (Beason et al., 2022; George and Beason, 2017):
PLEASE see important notes about this, below...
| Units |
1896 |
1913 |
1971 |
1981* |
1994 |
2009 |
2015 |
2021 |
| Volume, mi3 |
0.0238 |
0.0293 |
0.0268 |
0.0299 |
0.0279 |
0.0253 |
0.0234 |
0.0221 |
| Volume, km3 |
0.0993 |
0.1223 |
0.1119 |
0.1246 |
0.1164 |
0.1056 |
0.0975 |
0.0920 |
* = 1981 was the only year that glacial volumes have been measured. See note below.
Basal Shear Stress (τ): 2,706.23 lbs/ft2
Volume change between periods
|
1913 |
1971 |
1981 |
1994 |
2009 |
2015 |
2021 |
| 1896 |
0.0055 mi3
(0.0230 km3) |
0.0030 mi3
(0.0126 km3) |
0.0061 mi3
(0.0253 km3) |
0.0041 mi3
(0.0171 km3) |
0.0015 mi3
(0.0064 km3) |
-0.0004 mi3
(-0.0018 km3) |
-0.0017 mi3
(-0.0073 km3) |
| 1913 |
-- |
-0.0025 mi3
(-0.0104 km3) |
0.0006 mi3
(0.0023 km3) |
-0.0014 mi3
(-0.0059 km3) |
-0.0040 mi3
(-0.0166 km3) |
-0.0059 mi3
(-0.0248 km3) |
-0.0073 mi3
(-0.0303 km3) |
| 1971 |
|
-- |
0.0031 mi3
(0.0127 km3) |
0.0011 mi3
(0.0045 km3) |
-0.0015 mi3
(-0.0062 km3) |
-0.0035 mi3
(-0.0144 km3) |
-0.0048 mi3
(-0.0199 km3) |
| 1981 |
|
-- |
-0.0020 mi3
(-0.0082 km3) |
-0.0045 mi3
(-0.0190 km3) |
-0.0065 mi3
(-0.0271 km3) |
-0.0078 mi3
(-0.0326 km3) |
| 1994 |
|
-- |
-0.0026 mi3
(-0.0107 km3) |
-0.0045 mi3
(-0.0189 km3) |
-0.0059 mi3
(-0.0244 km3) |
| 2009 |
|
-- |
-0.0020 mi3
(-0.0082 km3) |
-0.0033 mi3
(-0.0137 km3) |
| 2015 |
|
-- |
-0.0013 mi3
(-0.0055 km3) |
Percent change between periods
|
1913 |
1971 |
1981 |
1994 |
2009 |
2015 |
2021 |
| 1896 |
23.18 % |
12.72 % |
25.53 % |
17.25 % |
6.43 % |
-1.81 % |
-7.34 % |
| 1913 |
-- |
-8.49 % |
1.91 % |
-4.81 % |
-13.60 % |
-20.28 % |
-24.77 % |
| 1971 |
|
-- |
11.37 % |
4.02 % |
-5.58 % |
-12.89 % |
-17.79 % |
| 1981 |
|
-- |
-6.60 % |
-15.22 % |
-21.78 % |
-26.18 % |
| 1994 |
|
-- |
-9.23 % |
-16.25 % |
-20.97 % |
| 2009 |
|
-- |
-7.74 % |
-12.94 % |
| 2015 |
|
-- |
-5.63 % |
With the exception of data in 1981, all values here are calculated estimates based on work by Driedger and Kennard (1986), which calculates glacier volumes with the following equations:
If Glacier Length (L) > 8,500 ft:
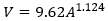
If Glacier Length (L) < 8,500 ft:
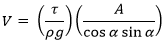
Basal shear stress (τ) is calculated as:
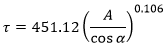
Where V is the calculated volume of the glacier (ft3), A is the calculated area of the glacier (ft2), ρ is the density of ice (1.779 slug/ft3), g is the acceleration of gravity (32.178 ft/s2), and α is the average slope of the glacier.
If you need a really good research project, recalculating the glacier volumes at Mount Rainier is the way to go!
|
NOTES:
Data References:
Beason et al., 2022,
Beason, 2017,
George and Beason, 2017,
Reese, 2009, and
Driedger and Kennard, 1986