Switch Glacier:
NOTE: This page has been updated to show 2021 extents and changes
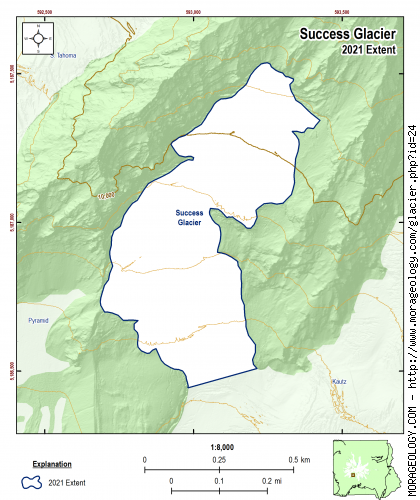
Success Glacier
This glacier is on the northwest arm of the Kautz Glacier. It is divided from the South Tahoma Glacier by Success Cleaver and is below Point Success. See: Success Cleaver. (Reese, 2009)
|
STATISTICS AS OF 2021 (Beason et al., 2022):
Aerial Extent:
0.150 ± 0.009 square miles
(0.388 ± 0.025 km2)
(Rank: 23 of 29)
Debris Cover (Based on Beason, 2017 - not updated in 2021):
0.030 ± 0.003 square miles
(0.078 ± 0.008 km2)
(Rank: 4 of 29)
Estimated Glacial Volume: (See notes below)
0.0018 cubic miles
(0.0075 km3)
Highest Elevation (Head):
10,625 feet
(3,239 m)
Lowest Elevation (Terminus):
8,477 feet
(2,584 m)
Elevation Range:
2,148 feet
(655 m)
Length:
0.74 miles
(1.19 km)
Average Slope:
29°
Average Flow Direction (Flows towards):
South (184°)
|
|
CHANGE IN EXTENT, 1896-2015 (Beason, 2017):
| Units |
1896 |
1913 |
1971 |
1994 |
2009 |
2015 |
2021 |
| Area, mi2 |
-- |
0.253 |
0.261 |
0.248 |
-- |
0.181 |
0.150 |
| Area, km2 |
-- |
0.655 |
0.677 |
0.641 |
-- |
0.470 |
0.388 |
Area change between periods
|
1913 |
1971 |
1994 |
2009 |
2015 |
2021 |
| 1896 |
0.253 mi2
(0.656 km2) |
0.262 mi2
(0.678 km2) |
0.248 mi2
(0.642 km2) |
0.000 mi2
(0.000 km2) |
0.182 mi2
(0.471 km2) |
0.150 mi2
(0.389 km2) |
| 1913 |
-- |
0.008 mi2
(0.022 km2) |
-0.005 mi2
(-0.014 km2) |
-0.253 mi2
(-0.656 km2) |
-0.072 mi2
(-0.186 km2) |
-0.103 mi2
(-0.267 km2) |
| 1971 |
|
-- |
-0.014 mi2
(-0.036 km2) |
-0.262 mi2
(-0.678 km2) |
-0.080 mi2
(-0.207 km2) |
-0.112 mi2
(-0.289 km2) |
| 1994 |
|
-- |
-0.248 mi2
(-0.642 km2) |
-0.066 mi2
(-0.171 km2) |
-0.098 mi2
(-0.253 km2) |
| 2009 |
|
-- |
0.182 mi2
(0.471 km2) |
0.150 mi2
(0.389 km2) |
| 2015 |
|
-- |
-0.032 mi2
(-0.082 km2) |
Percent change between periods
|
1913 |
1971 |
1994 |
2009 |
2015 |
2021 |
| 1896 |
-65,374.90 % |
-67,542.61 % |
-63,973.18 % |
0.00 % |
-46,897.81 % |
-38,769.48 % |
| 1913 |
-- |
3.32 % |
-2.15 % |
-100.15 % |
-28.31 % |
-40.76 % |
| 1971 |
|
-- |
-5.29 % |
-100.15 % |
-30.61 % |
-42.66 % |
| 1994 |
|
-- |
-100.16 % |
-26.73 % |
-39.46 % |
| 2009 |
|
-- |
-46,897.81 % |
-38,769.48 % |
| 2015 |
|
-- |
-17.37 % |
|
ESTIMATED CHANGE IN VOLUME, 1896-2021 (Beason et al., 2022; George and Beason, 2017):
PLEASE see important notes about this, below...
| Units |
1896 |
1913 |
1971 |
1981* |
1994 |
2009 |
2015 |
2021 |
| Volume, mi3 |
-- |
0.0033 |
0.0034 |
0.0034 |
0.0032 |
-- |
0.0022 |
0.0018 |
| Volume, km3 |
-- |
0.0136 |
0.0141 |
0.0142 |
0.0133 |
-- |
0.0093 |
0.0075 |
* = 1981 was the only year that glacial volumes have been measured. See note below.
Basal Shear Stress (τ): 2,354.77 lbs/ft2
Volume change between periods
|
1913 |
1971 |
1981 |
1994 |
2009 |
2015 |
2021 |
| 1896 |
0.0033 mi3
(0.0136 km3) |
0.0034 mi3
(0.0141 km3) |
0.0034 mi3
(0.0142 km3) |
0.0032 mi3
(0.0133 km3) |
0.0000 mi3
(0.0000 km3) |
0.0022 mi3
(0.0093 km3) |
0.0018 mi3
(0.0075 km3) |
| 1913 |
-- |
0.0001 mi3
(0.0005 km3) |
0.0001 mi3
(0.0006 km3) |
-0.0001 mi3
(-0.0003 km3) |
-0.0033 mi3
(-0.0136 km3) |
-0.0010 mi3
(-0.0042 km3) |
-0.0014 mi3
(-0.0060 km3) |
| 1971 |
|
-- |
0.0000 mi3
(0.0001 km3) |
-0.0002 mi3
(-0.0008 km3) |
-0.0034 mi3
(-0.0141 km3) |
-0.0011 mi3
(-0.0047 km3) |
-0.0016 mi3
(-0.0065 km3) |
| 1981 |
|
-- |
-0.0002 mi3
(-0.0009 km3) |
-0.0034 mi3
(-0.0142 km3) |
-0.0012 mi3
(-0.0048 km3) |
-0.0016 mi3
(-0.0066 km3) |
| 1994 |
|
-- |
-0.0032 mi3
(-0.0133 km3) |
-0.0009 mi3
(-0.0039 km3) |
-0.0014 mi3
(-0.0057 km3) |
| 2009 |
|
-- |
0.0022 mi3
(0.0093 km3) |
0.0018 mi3
(0.0075 km3) |
| 2015 |
|
-- |
-0.0004 mi3
(-0.0018 km3) |
Percent change between periods
|
1913 |
1971 |
1981 |
1994 |
2009 |
2015 |
2021 |
| 1896 |
-1,358,021.83 % |
-1,408,812.18 % |
-1,415,940.00 % |
-1,325,289.93 % |
0.00 % |
-934,287.04 % |
-753,985.23 % |
| 1913 |
-- |
3.74 % |
4.27 % |
-2.41 % |
-100.01 % |
-31.20 % |
-44.48 % |
| 1971 |
|
-- |
0.51 % |
-5.93 % |
-100.01 % |
-33.69 % |
-46.48 % |
| 1981 |
|
-- |
-6.40 % |
-100.01 % |
-34.02 % |
-46.75 % |
| 1994 |
|
-- |
-100.01 % |
-29.51 % |
-43.11 % |
| 2009 |
|
-- |
-934,287.04 % |
-753,985.23 % |
| 2015 |
|
-- |
-19.30 % |
With the exception of data in 1981, all values here are calculated estimates based on work by Driedger and Kennard (1986), which calculates glacier volumes with the following equations:
If Glacier Length (L) > 8,500 ft:
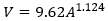
If Glacier Length (L) < 8,500 ft:
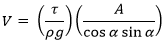
Basal shear stress (τ) is calculated as:
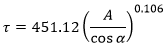
Where V is the calculated volume of the glacier (ft3), A is the calculated area of the glacier (ft2), ρ is the density of ice (1.779 slug/ft3), g is the acceleration of gravity (32.178 ft/s2), and α is the average slope of the glacier.
If you need a really good research project, recalculating the glacier volumes at Mount Rainier is the way to go!
|
NOTES:
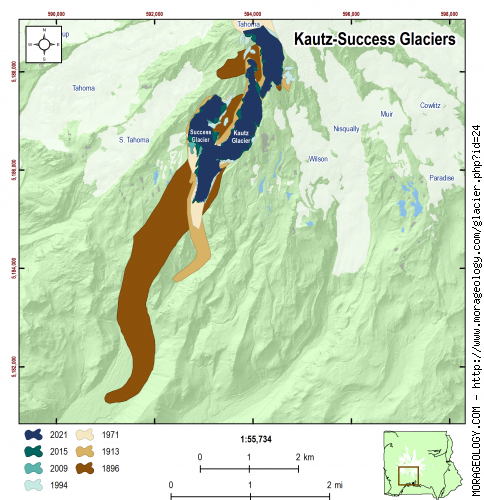
This glacier flows into the Kautz Glacier. Extent of this glacier in 1896 and 2009 was included with the combined Kautz/Success Glacier system. See Kautz Glacier for extent change over time.
Data References:
Beason et al., 2022,
Beason, 2017,
George and Beason, 2017,
Reese, 2009, and
Driedger and Kennard, 1986