Switch Glacier:
NOTE: This page has been updated to show 2021 extents and changes
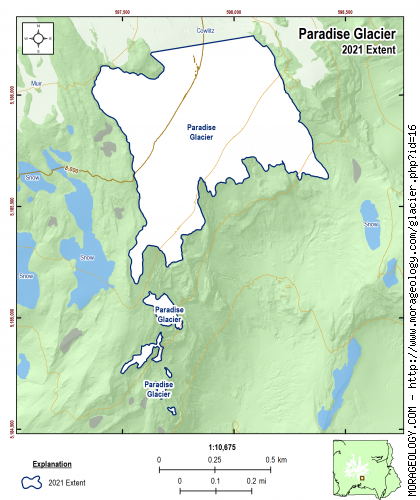
Paradise Glacier
This glacier originates on the south central slope of Mount Rainier between the Cowlitz and Nisqually Glaciers. It is subject to heavy melting in warm weather and once produced the well-known ice caves that were popular with visitors. When I.C. Russell and Bailey Willis explored the area in the summer of 1896 they called it a "...small interglacier..." (Reese, 2009)
|
STATISTICS AS OF 2021 (Beason et al., 2022):
Aerial Extent:
0.224 ± 0.014 square miles
(0.579 ± 0.035 km2)
(Rank: 21 of 29)
Debris Cover (Based on Beason, 2017 - not updated in 2021):
--No appreciable debris cover in 2015--
Estimated Glacial Volume: (See notes below)
0.0028 cubic miles
(0.0118 km3)
Highest Elevation (Head):
8,425 feet
(2,568 m)
Lowest Elevation (Terminus):
6,850 feet
(2,088 m)
Elevation Range:
1,575 feet
(480 m)
Length:
0.41 miles
(0.65 km)
Average Slope:
24°
Average Flow Direction (Flows towards):
East southeast (124°)
|
|
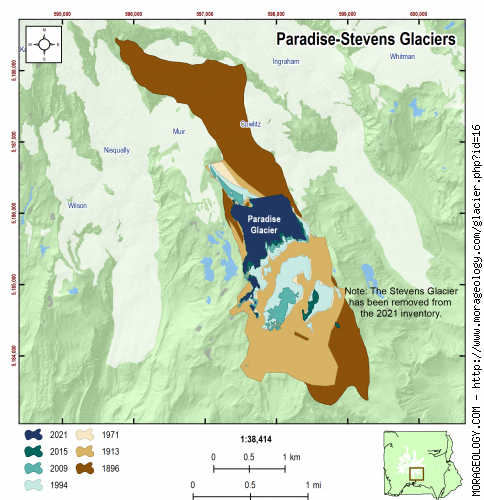
CHANGE IN EXTENT, 1896-2015 (Beason, 2017):
| Units |
1896 |
1913 |
1971 |
1994 |
2009 |
2015 |
2021 |
| Area, mi2 |
1.878 |
1.230 |
0.526 |
0.516 |
0.261 |
0.236 |
0.224 |
| Area, km2 |
4.863 |
3.186 |
1.364 |
1.338 |
0.677 |
0.612 |
0.579 |
Area change between periods
|
1913 |
1971 |
1994 |
2009 |
2015 |
2021 |
| 1896 |
-0.647 mi2
(-1.677 km2) |
-1.351 mi2
(-3.500 km2) |
-1.361 mi2
(-3.526 km2) |
-1.617 mi2
(-4.187 km2) |
-1.642 mi2
(-4.252 km2) |
-1.654 mi2
(-4.284 km2) |
| 1913 |
-- |
-0.704 mi2
(-1.823 km2) |
-0.714 mi2
(-1.849 km2) |
-0.969 mi2
(-2.510 km2) |
-0.994 mi2
(-2.575 km2) |
-1.007 mi2
(-2.607 km2) |
| 1971 |
|
-- |
-0.010 mi2
(-0.026 km2) |
-0.265 mi2
(-0.687 km2) |
-0.290 mi2
(-0.752 km2) |
-0.303 mi2
(-0.785 km2) |
| 1994 |
|
-- |
-0.255 mi2
(-0.661 km2) |
-0.280 mi2
(-0.726 km2) |
-0.293 mi2
(-0.759 km2) |
| 2009 |
|
-- |
-0.025 mi2
(-0.065 km2) |
-0.038 mi2
(-0.098 km2) |
| 2015 |
|
-- |
-0.013 mi2
(-0.033 km2) |
Percent change between periods
|
1913 |
1971 |
1994 |
2009 |
2015 |
2021 |
| 1896 |
-34.48 % |
-71.96 % |
-72.49 % |
-86.09 % |
-87.42 % |
-88.09 % |
| 1913 |
-- |
-57.21 % |
-58.02 % |
-78.77 % |
-80.80 % |
-81.83 % |
| 1971 |
|
-- |
-1.90 % |
-50.38 % |
-55.13 % |
-57.53 % |
| 1994 |
|
-- |
-49.42 % |
-54.26 % |
-56.71 % |
| 2009 |
|
-- |
-9.58 % |
-14.42 % |
| 2015 |
|
-- |
-5.36 % |
|
ESTIMATED CHANGE IN VOLUME, 1896-2021 (Beason et al., 2022; George and Beason, 2017):
PLEASE see important notes about this, below...
| Units |
1896 |
1913 |
1971 |
1981* |
1994 |
2009 |
2015 |
2021 |
| Volume, mi3 |
0.0310 |
0.0193 |
0.0074 |
0.0054 |
0.0073 |
0.0034 |
0.0030 |
0.0028 |
| Volume, km3 |
0.1292 |
0.0803 |
0.0309 |
0.0227 |
0.0303 |
0.0141 |
0.0126 |
0.0118 |
* = 1981 was the only year that glacial volumes have been measured. See note below.
Basal Shear Stress (τ): 2,403.13 lbs/ft2
Volume change between periods
|
1913 |
1971 |
1981 |
1994 |
2009 |
2015 |
2021 |
| 1896 |
-0.0117 mi3
(-0.0489 km3) |
-0.0236 mi3
(-0.0983 km3) |
-0.0256 mi3
(-0.1065 km3) |
-0.0237 mi3
(-0.0989 km3) |
-0.0276 mi3
(-0.1151 km3) |
-0.0280 mi3
(-0.1166 km3) |
-0.0282 mi3
(-0.1174 km3) |
| 1913 |
-- |
-0.0118 mi3
(-0.0494 km3) |
-0.0138 mi3
(-0.0577 km3) |
-0.0120 mi3
(-0.0500 km3) |
-0.0159 mi3
(-0.0663 km3) |
-0.0163 mi3
(-0.0678 km3) |
-0.0164 mi3
(-0.0685 km3) |
| 1971 |
|
-- |
-0.0020 mi3
(-0.0083 km3) |
-0.0002 mi3
(-0.0007 km3) |
-0.0040 mi3
(-0.0169 km3) |
-0.0044 mi3
(-0.0184 km3) |
-0.0046 mi3
(-0.0191 km3) |
| 1981 |
|
-- |
0.0018 mi3
(0.0076 km3) |
-0.0021 mi3
(-0.0086 km3) |
-0.0024 mi3
(-0.0101 km3) |
-0.0026 mi3
(-0.0108 km3) |
| 1994 |
|
-- |
-0.0039 mi3
(-0.0162 km3) |
-0.0042 mi3
(-0.0177 km3) |
-0.0044 mi3
(-0.0185 km3) |
| 2009 |
|
-- |
-0.0004 mi3
(-0.0015 km3) |
-0.0005 mi3
(-0.0023 km3) |
| 2015 |
|
-- |
-0.0002 mi3
(-0.0008 km3) |
Percent change between periods
|
1913 |
1971 |
1981 |
1994 |
2009 |
2015 |
2021 |
| 1896 |
-37.83 % |
-76.05 % |
-82.47 % |
-76.56 % |
-89.11 % |
-90.27 % |
-90.85 % |
| 1913 |
-- |
-61.48 % |
-71.80 % |
-62.30 % |
-82.48 % |
-84.35 % |
-85.29 % |
| 1971 |
|
-- |
-26.79 % |
-2.14 % |
-54.51 % |
-59.38 % |
-61.81 % |
| 1981 |
|
-- |
33.67 % |
-37.87 % |
-44.51 % |
-47.84 % |
| 1994 |
|
-- |
-53.52 % |
-58.49 % |
-60.98 % |
| 2009 |
|
-- |
-10.70 % |
-16.06 % |
| 2015 |
|
-- |
-6.00 % |
With the exception of data in 1981, all values here are calculated estimates based on work by Driedger and Kennard (1986), which calculates glacier volumes with the following equations:
If Glacier Length (L) > 8,500 ft:
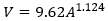
If Glacier Length (L) < 8,500 ft:
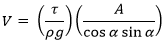
Basal shear stress (τ) is calculated as:
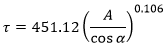
Where V is the calculated volume of the glacier (ft3), A is the calculated area of the glacier (ft2), ρ is the density of ice (1.779 slug/ft3), g is the acceleration of gravity (32.178 ft/s2), and α is the average slope of the glacier.
If you need a really good research project, recalculating the glacier volumes at Mount Rainier is the way to go!
|
NOTES:
Data References:
Beason et al., 2022,
Beason, 2017,
George and Beason, 2017,
Reese, 2009, and
Driedger and Kennard, 1986