Switch Glacier:
NOTE: This page has been updated to show 2021 extents and changes
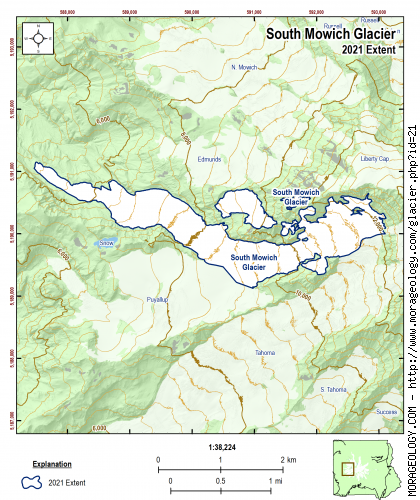
South Mowich Glacier
This glacier on the west side of Mount Rainier is between the Edmunds and the Puyallup glaciers. The word Mowich is Indian in origin and means "deer" or "animal." It is drained by the South Mowich River which is joined by the North Mowich River to form the Mowich River. (Reese, 2009)
|
STATISTICS AS OF 2021 (Beason et al., 2022):
Aerial Extent:
1.398 ± 0.076 square miles
(3.621 ± 0.197 km2)
(Rank: 8 of 29)
Debris Cover (Based on Beason, 2017 - not updated in 2021):
0.304 ± 0.020 square miles
(0.788 ± 0.051 km2)
(Rank: 3 of 29)
Estimated Glacial Volume: (See notes below)
0.0299 cubic miles
(0.1244 km3)
Highest Elevation (Head):
12,839 feet
(3,913 m)
Lowest Elevation (Terminus):
4,897 feet
(1,493 m)
Elevation Range:
7,942 feet
(2,421 m)
Length:
3.78 miles
(6.08 km)
Average Slope:
26°
Average Flow Direction (Flows towards):
West (272°)
|
|
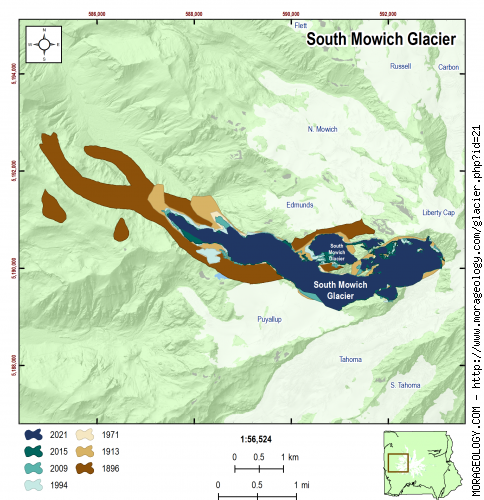
CHANGE IN EXTENT, 1896-2015 (Beason, 2017):
| Units |
1896 |
1913 |
1971 |
1994 |
2009 |
2015 |
2021 |
| Area, mi2 |
2.058 |
1.815 |
1.579 |
1.568 |
1.530 |
1.454 |
1.398 |
| Area, km2 |
5.331 |
4.700 |
4.091 |
4.061 |
3.963 |
3.766 |
3.621 |
Area change between periods
|
1913 |
1971 |
1994 |
2009 |
2015 |
2021 |
| 1896 |
-0.244 mi2
(-0.631 km2) |
-0.479 mi2
(-1.240 km2) |
-0.490 mi2
(-1.270 km2) |
-0.528 mi2
(-1.368 km2) |
-0.604 mi2
(-1.565 km2) |
-0.660 mi2
(-1.710 km2) |
| 1913 |
-- |
-0.235 mi2
(-0.609 km2) |
-0.247 mi2
(-0.639 km2) |
-0.285 mi2
(-0.737 km2) |
-0.361 mi2
(-0.934 km2) |
-0.417 mi2
(-1.079 km2) |
| 1971 |
|
-- |
-0.012 mi2
(-0.030 km2) |
-0.049 mi2
(-0.128 km2) |
-0.126 mi2
(-0.325 km2) |
-0.181 mi2
(-0.470 km2) |
| 1994 |
|
-- |
-0.038 mi2
(-0.098 km2) |
-0.114 mi2
(-0.295 km2) |
-0.170 mi2
(-0.440 km2) |
| 2009 |
|
-- |
-0.076 mi2
(-0.197 km2) |
-0.132 mi2
(-0.342 km2) |
| 2015 |
|
-- |
-0.056 mi2
(-0.145 km2) |
Percent change between periods
|
1913 |
1971 |
1994 |
2009 |
2015 |
2021 |
| 1896 |
-11.83 % |
-23.26 % |
-23.83 % |
-25.66 % |
-29.36 % |
-32.07 % |
| 1913 |
-- |
-12.96 % |
-13.60 % |
-15.68 % |
-19.88 % |
-22.96 % |
| 1971 |
|
-- |
-0.74 % |
-3.13 % |
-7.95 % |
-11.48 % |
| 1994 |
|
-- |
-2.41 % |
-7.27 % |
-10.82 % |
| 2009 |
|
-- |
-4.98 % |
-8.62 % |
| 2015 |
|
-- |
-3.84 % |
|
ESTIMATED CHANGE IN VOLUME, 1896-2021 (Beason et al., 2022; George and Beason, 2017):
PLEASE see important notes about this, below...
| Units |
1896 |
1913 |
1971 |
1981* |
1994 |
2009 |
2015 |
2021 |
| Volume, mi3 |
0.0441 |
0.0389 |
0.0339 |
0.0306 |
0.0336 |
0.0328 |
0.0312 |
0.0299 |
| Volume, km3 |
0.1839 |
0.1622 |
0.1412 |
0.1274 |
0.1401 |
0.1367 |
0.1299 |
0.1244 |
* = 1981 was the only year that glacial volumes have been measured. See note below.
Basal Shear Stress (τ): 2,941.84 lbs/ft2
Volume change between periods
|
1913 |
1971 |
1981 |
1994 |
2009 |
2015 |
2021 |
| 1896 |
-0.0052 mi3
(-0.0218 km3) |
-0.0103 mi3
(-0.0428 km3) |
-0.0136 mi3
(-0.0565 km3) |
-0.0105 mi3
(-0.0438 km3) |
-0.0113 mi3
(-0.0472 km3) |
-0.0130 mi3
(-0.0540 km3) |
-0.0143 mi3
(-0.0595 km3) |
| 1913 |
-- |
-0.0050 mi3
(-0.0210 km3) |
-0.0083 mi3
(-0.0347 km3) |
-0.0053 mi3
(-0.0221 km3) |
-0.0061 mi3
(-0.0254 km3) |
-0.0077 mi3
(-0.0322 km3) |
-0.0091 mi3
(-0.0377 km3) |
| 1971 |
|
-- |
-0.0033 mi3
(-0.0137 km3) |
-0.0003 mi3
(-0.0010 km3) |
-0.0011 mi3
(-0.0044 km3) |
-0.0027 mi3
(-0.0112 km3) |
-0.0040 mi3
(-0.0167 km3) |
| 1981 |
|
-- |
0.0030 mi3
(0.0127 km3) |
0.0022 mi3
(0.0093 km3) |
0.0006 mi3
(0.0025 km3) |
-0.0007 mi3
(-0.0030 km3) |
| 1994 |
|
-- |
-0.0008 mi3
(-0.0034 km3) |
-0.0024 mi3
(-0.0102 km3) |
-0.0038 mi3
(-0.0157 km3) |
| 2009 |
|
-- |
-0.0016 mi3
(-0.0068 km3) |
-0.0030 mi3
(-0.0123 km3) |
| 2015 |
|
-- |
-0.0013 mi3
(-0.0055 km3) |
Percent change between periods
|
1913 |
1971 |
1981 |
1994 |
2009 |
2015 |
2021 |
| 1896 |
-11.83 % |
-23.26 % |
-30.72 % |
-23.83 % |
-25.66 % |
-29.36 % |
-32.35 % |
| 1913 |
-- |
-12.96 % |
-21.42 % |
-13.60 % |
-15.68 % |
-19.88 % |
-23.27 % |
| 1971 |
|
-- |
-9.72 % |
-0.74 % |
-3.13 % |
-7.95 % |
-11.85 % |
| 1981 |
|
-- |
9.95 % |
7.31 % |
1.96 % |
-2.35 % |
| 1994 |
|
-- |
-2.41 % |
-7.27 % |
-11.19 % |
| 2009 |
|
-- |
-4.98 % |
-9.00 % |
| 2015 |
|
-- |
-4.24 % |
With the exception of data in 1981, all values here are calculated estimates based on work by Driedger and Kennard (1986), which calculates glacier volumes with the following equations:
If Glacier Length (L) > 8,500 ft:
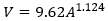
If Glacier Length (L) < 8,500 ft:
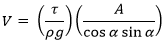
Basal shear stress (τ) is calculated as:
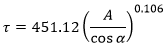
Where V is the calculated volume of the glacier (ft3), A is the calculated area of the glacier (ft2), ρ is the density of ice (1.779 slug/ft3), g is the acceleration of gravity (32.178 ft/s2), and α is the average slope of the glacier.
If you need a really good research project, recalculating the glacier volumes at Mount Rainier is the way to go!
|
NOTES:
Data References:
Beason et al., 2022,
Beason, 2017,
George and Beason, 2017,
Reese, 2009, and
Driedger and Kennard, 1986