Switch Glacier:
NOTE: This page has been updated to show 2021 extents and changes
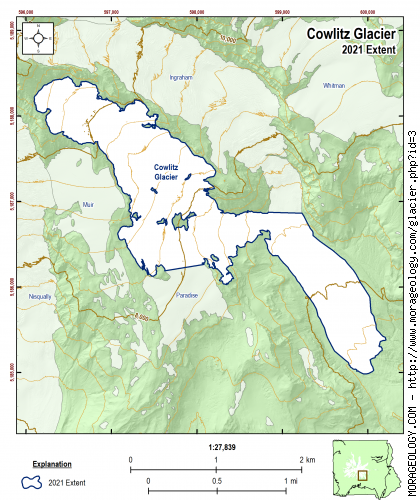
Cowlitz Glacier
Cowlitz is the name of many geographical features in the State of Washington including those within the National Park. The name appears in print as early as the Lewis and Clark journals of 1805 where it was written as "Cowliskee." The word is said to mean "...capturing the medicine spirit." Locations named Cowlitz begin on the Cowlitz Glacier on the southeast side of Mount Rainier and continue in the Cowlitz River, which flows south into Cowlitz County. (Reese, 2009)
|
STATISTICS AS OF 2021 (Beason et al., 2022):
Aerial Extent:
1.415 ± 0.077 square miles
(3.664 ± 0.199 km2)
(Rank: 7 of 29)
Debris Cover (Based on Beason, 2017 - not updated in 2021):
0.555 ± 0.034 square miles
(1.438 ± 0.088 km2)
(Rank: 5 of 29)
Estimated Glacial Volume: (See notes below)
0.0356 cubic miles
(0.1483 km3)
Highest Elevation (Head):
11,137 feet
(3,395 m)
Lowest Elevation (Terminus):
5,232 feet
(1,595 m)
Elevation Range:
5,905 feet
(1,800 m)
Length:
3.48 miles
(5.59 km)
Average Slope:
23°
Average Flow Direction (Flows towards):
East southeast (121°)
|
|
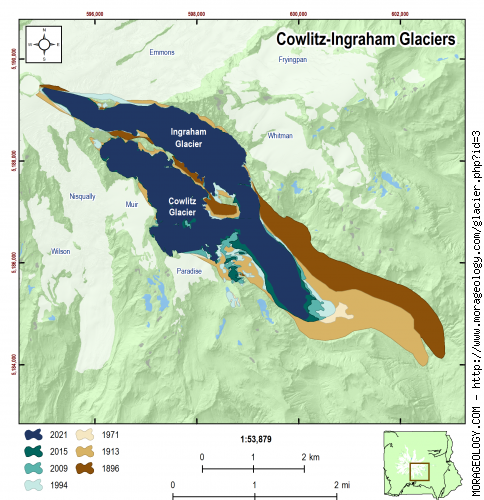
CHANGE IN EXTENT, 1896-2015 (Beason, 2017):
| Units |
1896 |
1913 |
1971 |
1994 |
2009 |
2015 |
2021 |
| Area, mi2 |
3.208 |
3.798 |
2.950 |
2.972 |
2.721 |
1.541 |
1.415 |
| Area, km2 |
8.310 |
9.838 |
7.639 |
7.697 |
7.048 |
3.990 |
3.664 |
Area change between periods
|
1913 |
1971 |
1994 |
2009 |
2015 |
2021 |
| 1896 |
0.590 mi2
(1.528 km2) |
-0.259 mi2
(-0.670 km2) |
-0.237 mi2
(-0.613 km2) |
-0.487 mi2
(-1.262 km2) |
-1.668 mi2
(-4.319 km2) |
-1.794 mi2
(-4.646 km2) |
| 1913 |
-- |
-0.849 mi2
(-2.199 km2) |
-0.827 mi2
(-2.141 km2) |
-1.077 mi2
(-2.790 km2) |
-2.258 mi2
(-5.848 km2) |
-2.384 mi2
(-6.174 km2) |
| 1971 |
|
-- |
0.022 mi2
(0.058 km2) |
-0.228 mi2
(-0.592 km2) |
-1.409 mi2
(-3.649 km2) |
-1.535 mi2
(-3.976 km2) |
| 1994 |
|
-- |
-0.251 mi2
(-0.649 km2) |
-1.431 mi2
(-3.707 km2) |
-1.557 mi2
(-4.033 km2) |
| 2009 |
|
-- |
-1.180 mi2
(-3.057 km2) |
-1.307 mi2
(-3.384 km2) |
| 2015 |
|
-- |
-0.126 mi2
(-0.327 km2) |
Percent change between periods
|
1913 |
1971 |
1994 |
2009 |
2015 |
2021 |
| 1896 |
18.39 % |
-8.07 % |
-7.37 % |
-15.19 % |
-51.98 % |
-55.91 % |
| 1913 |
-- |
-22.35 % |
-21.76 % |
-28.36 % |
-59.44 % |
-62.76 % |
| 1971 |
|
-- |
0.75 % |
-7.75 % |
-47.77 % |
-52.04 % |
| 1994 |
|
-- |
-8.44 % |
-48.16 % |
-52.40 % |
| 2009 |
|
-- |
-43.38 % |
-48.02 % |
| 2015 |
|
-- |
-8.19 % |
|
ESTIMATED CHANGE IN VOLUME, 1896-2021 (Beason et al., 2022; George and Beason, 2017):
PLEASE see important notes about this, below...
| Units |
1896 |
1913 |
1971 |
1981* |
1994 |
2009 |
2015 |
2021 |
| Volume, mi3 |
0.0814 |
0.0964 |
0.0749 |
0.0408 |
0.0754 |
0.0691 |
0.0391 |
0.0356 |
| Volume, km3 |
0.3394 |
0.4018 |
0.3120 |
0.1699 |
0.3144 |
0.2878 |
0.1630 |
0.1483 |
* = 1981 was the only year that glacial volumes have been measured. See note below.
Basal Shear Stress (τ): 2,937.13 lbs/ft2
Volume change between periods
|
1913 |
1971 |
1981 |
1994 |
2009 |
2015 |
2021 |
| 1896 |
0.0150 mi3
(0.0624 km3) |
-0.0066 mi3
(-0.0274 km3) |
-0.0407 mi3
(-0.1695 km3) |
-0.0060 mi3
(-0.0250 km3) |
-0.0124 mi3
(-0.0515 km3) |
-0.0423 mi3
(-0.1764 km3) |
-0.0458 mi3
(-0.1911 km3) |
| 1913 |
-- |
-0.0215 mi3
(-0.0898 km3) |
-0.0556 mi3
(-0.2319 km3) |
-0.0210 mi3
(-0.0874 km3) |
-0.0273 mi3
(-0.1140 km3) |
-0.0573 mi3
(-0.2388 km3) |
-0.0608 mi3
(-0.2535 km3) |
| 1971 |
|
-- |
-0.0341 mi3
(-0.1421 km3) |
0.0006 mi3
(0.0024 km3) |
-0.0058 mi3
(-0.0242 km3) |
-0.0358 mi3
(-0.1490 km3) |
-0.0393 mi3
(-0.1637 km3) |
| 1981 |
|
-- |
0.0347 mi3
(0.1445 km3) |
0.0283 mi3
(0.1179 km3) |
-0.0017 mi3
(-0.0069 km3) |
-0.0052 mi3
(-0.0216 km3) |
| 1994 |
|
-- |
-0.0064 mi3
(-0.0265 km3) |
-0.0363 mi3
(-0.1514 km3) |
-0.0398 mi3
(-0.1661 km3) |
| 2009 |
|
-- |
-0.0300 mi3
(-0.1249 km3) |
-0.0335 mi3
(-0.1396 km3) |
| 2015 |
|
-- |
-0.0035 mi3
(-0.0147 km3) |
Percent change between periods
|
1913 |
1971 |
1981 |
1994 |
2009 |
2015 |
2021 |
| 1896 |
18.39 % |
-8.07 % |
-49.94 % |
-7.37 % |
-15.19 % |
-51.98 % |
-56.31 % |
| 1913 |
-- |
-22.35 % |
-57.72 % |
-21.76 % |
-28.36 % |
-59.44 % |
-63.10 % |
| 1971 |
|
-- |
-45.54 % |
0.75 % |
-7.75 % |
-47.77 % |
-52.48 % |
| 1981 |
|
-- |
85.02 % |
69.41 % |
-4.08 % |
-12.73 % |
| 1994 |
|
-- |
-8.44 % |
-48.16 % |
-52.83 % |
| 2009 |
|
-- |
-43.38 % |
-48.49 % |
| 2015 |
|
-- |
-9.02 % |
With the exception of data in 1981, all values here are calculated estimates based on work by Driedger and Kennard (1986), which calculates glacier volumes with the following equations:
If Glacier Length (L) > 8,500 ft:
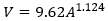
If Glacier Length (L) < 8,500 ft:
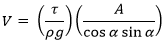
Basal shear stress (τ) is calculated as:
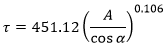
Where V is the calculated volume of the glacier (ft3), A is the calculated area of the glacier (ft2), ρ is the density of ice (1.779 slug/ft3), g is the acceleration of gravity (32.178 ft/s2), and α is the average slope of the glacier.
If you need a really good research project, recalculating the glacier volumes at Mount Rainier is the way to go!
|
NOTES:
Data References:
Beason et al., 2022,
Beason, 2017,
George and Beason, 2017,
Reese, 2009, and
Driedger and Kennard, 1986