Switch Glacier:
NOTE: This page has been updated to show 2021 extents and changes
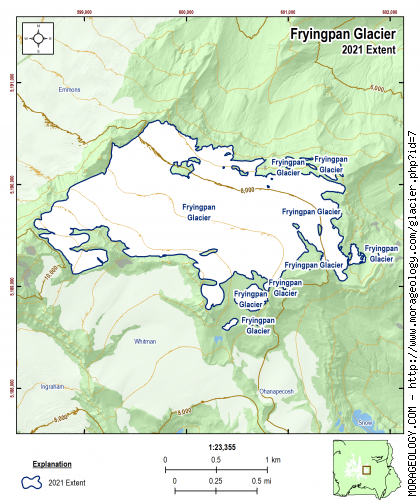
Fryingpan Glacier
Fryingpan Glacier is on the east central slope of Mount Rainier. There are two stories for the origin of the name; one that some campers lost a frying pan in the creek or two, that the glacier itself is shaped like a frying pan. F. G. Plummer calls this glacier Urania to honor the Urania Society of New York. (Reese, 2009)
|
STATISTICS AS OF 2021 (Beason et al., 2022):
Aerial Extent:
1.154 ± 0.063 square miles
(2.990 ± 0.164 km2)
(Rank: 11 of 29)
Debris Cover (Based on Beason, 2017 - not updated in 2021):
0.049 ± 0.004 square miles
(0.128 ± 0.011 km2)
(Rank: 11 of 29)
Estimated Glacial Volume: (See notes below)
0.0179 cubic miles
(0.0748 km3)
Highest Elevation (Head):
9,930 feet
(3,027 m)
Lowest Elevation (Terminus):
7,093 feet
(2,162 m)
Elevation Range:
2,838 feet
(865 m)
Length:
0.98 miles
(1.59 km)
Average Slope:
22°
Average Flow Direction (Flows towards):
Northeast (38°)
|
|
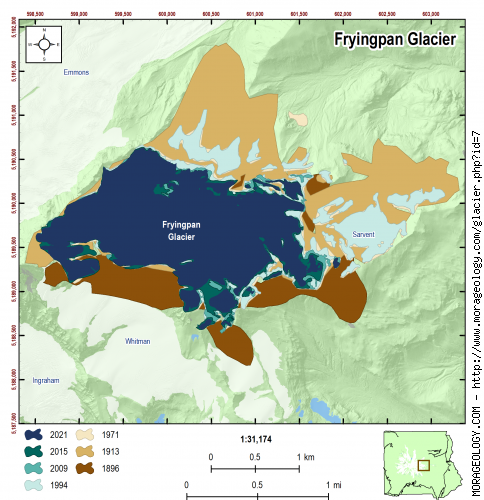
CHANGE IN EXTENT, 1896-2015 (Beason, 2017):
| Units |
1896 |
1913 |
1971 |
1994 |
2009 |
2015 |
2021 |
| Area, mi2 |
1.437 |
2.363 |
1.675 |
1.634 |
1.273 |
1.253 |
1.154 |
| Area, km2 |
3.722 |
6.121 |
4.339 |
4.231 |
3.297 |
3.245 |
2.990 |
Area change between periods
|
1913 |
1971 |
1994 |
2009 |
2015 |
2021 |
| 1896 |
0.926 mi2
(2.399 km2) |
0.238 mi2
(0.617 km2) |
0.197 mi2
(0.509 km2) |
-0.164 mi2
(-0.425 km2) |
-0.184 mi2
(-0.477 km2) |
-0.282 mi2
(-0.732 km2) |
| 1913 |
-- |
-0.688 mi2
(-1.782 km2) |
-0.730 mi2
(-1.890 km2) |
-1.090 mi2
(-2.824 km2) |
-1.110 mi2
(-2.876 km2) |
-1.209 mi2
(-3.131 km2) |
| 1971 |
|
-- |
-0.042 mi2
(-0.108 km2) |
-0.402 mi2
(-1.042 km2) |
-0.422 mi2
(-1.094 km2) |
-0.521 mi2
(-1.348 km2) |
| 1994 |
|
-- |
-0.361 mi2
(-0.934 km2) |
-0.381 mi2
(-0.986 km2) |
-0.479 mi2
(-1.241 km2) |
| 2009 |
|
-- |
-0.020 mi2
(-0.052 km2) |
-0.118 mi2
(-0.307 km2) |
| 2015 |
|
-- |
-0.098 mi2
(-0.254 km2) |
Percent change between periods
|
1913 |
1971 |
1994 |
2009 |
2015 |
2021 |
| 1896 |
64.46 % |
16.57 % |
13.68 % |
-11.42 % |
-12.82 % |
-19.66 % |
| 1913 |
-- |
-29.12 % |
-30.88 % |
-46.14 % |
-46.99 % |
-51.15 % |
| 1971 |
|
-- |
-2.48 % |
-24.01 % |
-25.22 % |
-31.08 % |
| 1994 |
|
-- |
-22.08 % |
-23.31 % |
-29.33 % |
| 2009 |
|
-- |
-1.58 % |
-9.30 % |
| 2015 |
|
-- |
-7.84 % |
|
ESTIMATED CHANGE IN VOLUME, 1896-2021 (Beason et al., 2022; George and Beason, 2017):
PLEASE see important notes about this, below...
| Units |
1896 |
1913 |
1971 |
1981* |
1994 |
2009 |
2015 |
2021 |
| Volume, mi3 |
0.0229 |
0.0401 |
0.0273 |
0.0197 |
0.0265 |
0.0200 |
0.0197 |
0.0179 |
| Volume, km3 |
0.0956 |
0.1673 |
0.1136 |
0.0821 |
0.1105 |
0.0835 |
0.0820 |
0.0748 |
* = 1981 was the only year that glacial volumes have been measured. See note below.
Basal Shear Stress (τ): 2,871.23 lbs/ft2
Volume change between periods
|
1913 |
1971 |
1981 |
1994 |
2009 |
2015 |
2021 |
| 1896 |
0.0172 mi3
(0.0717 km3) |
0.0043 mi3
(0.0180 km3) |
-0.0032 mi3
(-0.0135 km3) |
0.0036 mi3
(0.0148 km3) |
-0.0029 mi3
(-0.0122 km3) |
-0.0033 mi3
(-0.0137 km3) |
-0.0050 mi3
(-0.0209 km3) |
| 1913 |
-- |
-0.0129 mi3
(-0.0537 km3) |
-0.0204 mi3
(-0.0852 km3) |
-0.0136 mi3
(-0.0568 km3) |
-0.0201 mi3
(-0.0839 km3) |
-0.0205 mi3
(-0.0853 km3) |
-0.0222 mi3
(-0.0925 km3) |
| 1971 |
|
-- |
-0.0076 mi3
(-0.0315 km3) |
-0.0008 mi3
(-0.0032 km3) |
-0.0072 mi3
(-0.0302 km3) |
-0.0076 mi3
(-0.0317 km3) |
-0.0093 mi3
(-0.0389 km3) |
| 1981 |
|
-- |
0.0068 mi3
(0.0284 km3) |
0.0003 mi3
(0.0013 km3) |
0.0000 mi3
(-0.0001 km3) |
-0.0018 mi3
(-0.0073 km3) |
| 1994 |
|
-- |
-0.0065 mi3
(-0.0270 km3) |
-0.0068 mi3
(-0.0285 km3) |
-0.0086 mi3
(-0.0357 km3) |
| 2009 |
|
-- |
-0.0004 mi3
(-0.0015 km3) |
-0.0021 mi3
(-0.0087 km3) |
| 2015 |
|
-- |
-0.0017 mi3
(-0.0072 km3) |
Percent change between periods
|
1913 |
1971 |
1981 |
1994 |
2009 |
2015 |
2021 |
| 1896 |
74.92 % |
18.81 % |
-14.14 % |
15.50 % |
-12.74 % |
-14.29 % |
-21.81 % |
| 1913 |
-- |
-32.08 % |
-50.92 % |
-33.97 % |
-50.12 % |
-51.00 % |
-55.30 % |
| 1971 |
|
-- |
-27.74 % |
-2.78 % |
-26.56 % |
-27.86 % |
-34.19 % |
| 1981 |
|
-- |
34.53 % |
1.63 % |
-0.17 % |
-8.93 % |
| 1994 |
|
-- |
-24.46 % |
-25.80 % |
-32.30 % |
| 2009 |
|
-- |
-1.77 % |
-10.39 % |
| 2015 |
|
-- |
-8.77 % |
With the exception of data in 1981, all values here are calculated estimates based on work by Driedger and Kennard (1986), which calculates glacier volumes with the following equations:
If Glacier Length (L) > 8,500 ft:
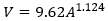
If Glacier Length (L) < 8,500 ft:
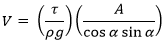
Basal shear stress (τ) is calculated as:
Where V is the calculated volume of the glacier (ft3), A is the calculated area of the glacier (ft2), ρ is the density of ice (1.779 slug/ft3), g is the acceleration of gravity (32.178 ft/s2), and α is the average slope of the glacier.
If you need a really good research project, recalculating the glacier volumes at Mount Rainier is the way to go!
|
NOTES:
Data References:
Beason et al., 2022,
Beason, 2017,
George and Beason, 2017,
Reese, 2009, and
Driedger and Kennard, 1986