Switch Glacier:
NOTE: This page has been updated to show 2021 extents and changes
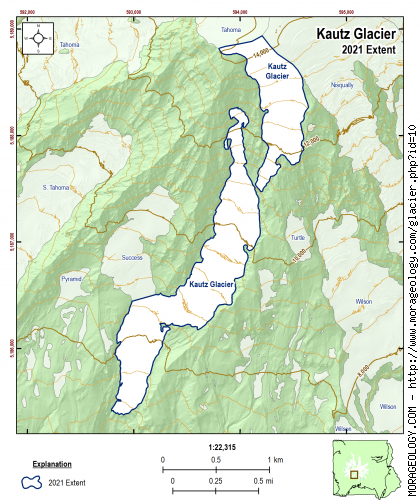
Kautz Glacier
Kautz Glacier is long and fairly narrow as it leads from its snout near Mildred Point to the top of Mount Rainier. The cleaver between the upper part of the Glacier and those to the east is named for Wapowety, the Indian guide of the Kautz Party on its unsuccessful attempt to climb the mountain in July of 1857. (Reese, 2009)
|
STATISTICS AS OF 2021 (Beason et al., 2022):
Aerial Extent:
0.594 ± 0.034 square miles
(1.537 ± 0.087 km2)
(Rank: 16 of 29)
Debris Cover (Based on Beason, 2017 - not updated in 2021):
0.134 ± 0.010 square miles
(0.346 ± 0.025 km2)
(Rank: 8 of 29)
Estimated Glacial Volume: (See notes below)
0.0111 cubic miles
(0.0465 km3)
Highest Elevation (Head):
14,131 feet
(4,307 m)
Lowest Elevation (Terminus):
6,917 feet
(2,108 m)
Elevation Range:
7,213 feet
(2,199 m)
Length:
2.59 miles
(4.17 km)
Average Slope:
29°
Average Flow Direction (Flows towards):
South southwest (193°)
|
|
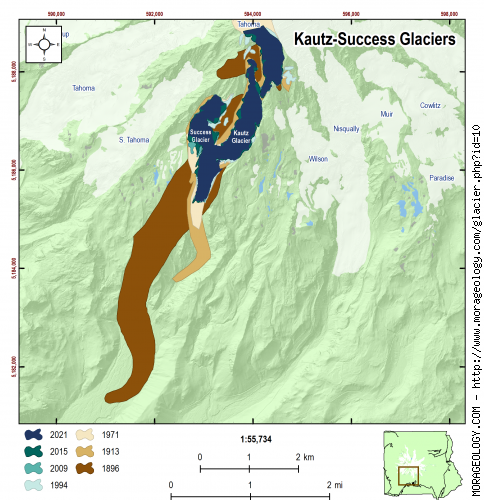
CHANGE IN EXTENT, 1896-2015 (Beason, 2017):
| Units |
1896 |
1913 |
1971 |
1994 |
2009 |
2015 |
2021 |
| Area, mi2 |
1.998 |
0.916 |
0.792 |
0.602 |
0.821 |
0.622 |
0.594 |
| Area, km2 |
5.174 |
2.373 |
2.051 |
1.560 |
2.125 |
1.611 |
1.537 |
Area change between periods
|
1913 |
1971 |
1994 |
2009 |
2015 |
2021 |
| 1896 |
-1.082 mi2
(-2.801 km2) |
-1.206 mi2
(-3.123 km2) |
-1.396 mi2
(-3.615 km2) |
-1.177 mi2
(-3.049 km2) |
-1.376 mi2
(-3.563 km2) |
-1.404 mi2
(-3.637 km2) |
| 1913 |
-- |
-0.124 mi2
(-0.322 km2) |
-0.314 mi2
(-0.813 km2) |
-0.096 mi2
(-0.248 km2) |
-0.294 mi2
(-0.762 km2) |
-0.323 mi2
(-0.835 km2) |
| 1971 |
|
-- |
-0.190 mi2
(-0.491 km2) |
0.029 mi2
(0.074 km2) |
-0.170 mi2
(-0.440 km2) |
-0.198 mi2
(-0.514 km2) |
| 1994 |
|
-- |
0.218 mi2
(0.565 km2) |
0.020 mi2
(0.051 km2) |
-0.009 mi2
(-0.022 km2) |
| 2009 |
|
-- |
-0.199 mi2
(-0.514 km2) |
-0.227 mi2
(-0.588 km2) |
| 2015 |
|
-- |
-0.028 mi2
(-0.074 km2) |
Percent change between periods
|
1913 |
1971 |
1994 |
2009 |
2015 |
2021 |
| 1896 |
-54.14 % |
-60.36 % |
-69.86 % |
-58.93 % |
-68.87 % |
-70.29 % |
| 1913 |
-- |
-13.56 % |
-34.27 % |
-10.43 % |
-32.11 % |
-35.21 % |
| 1971 |
|
-- |
-23.95 % |
3.62 % |
-21.46 % |
-25.04 % |
| 1994 |
|
-- |
36.25 % |
3.28 % |
-1.44 % |
| 2009 |
|
-- |
-24.20 % |
-27.66 % |
| 2015 |
|
-- |
-4.57 % |
|
ESTIMATED CHANGE IN VOLUME, 1896-2021 (Beason et al., 2022; George and Beason, 2017):
PLEASE see important notes about this, below...
| Units |
1896 |
1913 |
1971 |
1981* |
1994 |
2009 |
2015 |
2021 |
| Volume, mi3 |
0.0377 |
0.0173 |
0.0149 |
0.0088 |
0.0114 |
0.0155 |
0.0117 |
0.0111 |
| Volume, km3 |
0.1572 |
0.0721 |
0.0623 |
0.0368 |
0.0474 |
0.0646 |
0.0489 |
0.0465 |
* = 1981 was the only year that glacial volumes have been measured. See note below.
Basal Shear Stress (τ): 2,698.50 lbs/ft2
Volume change between periods
|
1913 |
1971 |
1981 |
1994 |
2009 |
2015 |
2021 |
| 1896 |
-0.0204 mi3
(-0.0851 km3) |
-0.0228 mi3
(-0.0949 km3) |
-0.0289 mi3
(-0.1204 km3) |
-0.0263 mi3
(-0.1098 km3) |
-0.0222 mi3
(-0.0926 km3) |
-0.0260 mi3
(-0.1082 km3) |
-0.0266 mi3
(-0.1107 km3) |
| 1913 |
-- |
-0.0023 mi3
(-0.0098 km3) |
-0.0085 mi3
(-0.0353 km3) |
-0.0059 mi3
(-0.0247 km3) |
-0.0018 mi3
(-0.0075 km3) |
-0.0056 mi3
(-0.0231 km3) |
-0.0061 mi3
(-0.0256 km3) |
| 1971 |
|
-- |
-0.0061 mi3
(-0.0255 km3) |
-0.0036 mi3
(-0.0149 km3) |
0.0005 mi3
(0.0023 km3) |
-0.0032 mi3
(-0.0134 km3) |
-0.0038 mi3
(-0.0158 km3) |
| 1981 |
|
-- |
0.0025 mi3
(0.0106 km3) |
0.0067 mi3
(0.0277 km3) |
0.0029 mi3
(0.0121 km3) |
0.0023 mi3
(0.0097 km3) |
| 1994 |
|
-- |
0.0041 mi3
(0.0172 km3) |
0.0004 mi3
(0.0016 km3) |
-0.0002 mi3
(-0.0009 km3) |
| 2009 |
|
-- |
-0.0037 mi3
(-0.0156 km3) |
-0.0043 mi3
(-0.0181 km3) |
| 2015 |
|
-- |
-0.0006 mi3
(-0.0025 km3) |
Percent change between periods
|
1913 |
1971 |
1981 |
1994 |
2009 |
2015 |
2021 |
| 1896 |
-54.14 % |
-60.36 % |
-76.58 % |
-69.86 % |
-58.93 % |
-68.87 % |
-70.43 % |
| 1913 |
-- |
-13.56 % |
-48.93 % |
-34.27 % |
-10.43 % |
-32.11 % |
-35.53 % |
| 1971 |
|
-- |
-40.92 % |
-23.95 % |
3.62 % |
-21.46 % |
-25.41 % |
| 1981 |
|
-- |
28.71 % |
75.38 % |
32.94 % |
26.24 % |
| 1994 |
|
-- |
36.25 % |
3.28 % |
-1.92 % |
| 2009 |
|
-- |
-24.20 % |
-28.02 % |
| 2015 |
|
-- |
-5.04 % |
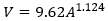
With the exception of data in 1981, all values here are calculated estimates based on work by Driedger and Kennard (1986), which calculates glacier volumes with the following equations:
If Glacier Length (L) > 8,500 ft:
If Glacier Length (L) < 8,500 ft:
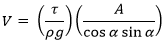
Basal shear stress (τ) is calculated as:
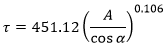
Where V is the calculated volume of the glacier (ft3), A is the calculated area of the glacier (ft2), ρ is the density of ice (1.779 slug/ft3), g is the acceleration of gravity (32.178 ft/s2), and α is the average slope of the glacier.
If you need a really good research project, recalculating the glacier volumes at Mount Rainier is the way to go!
|
NOTES:
Data References:
Beason et al., 2022,
Beason, 2017,
George and Beason, 2017,
Reese, 2009, and
Driedger and Kennard, 1986