Switch Glacier:
NOTE: This page has been updated to show 2021 extents and changes
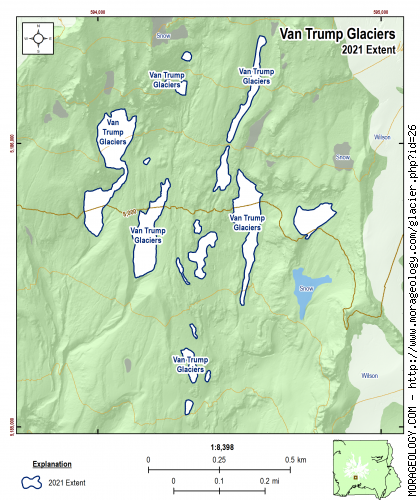
Van Trump Glaciers
Van Trump is the name of a glacier in Mount Rainier National Park. It was named for P. B. Van Trump who, with Hazard Stevens, was the first to reach the summit of the Mountain. Van Trump subsequently made several ascents of the mountain including one with John Muir in 1888. Mr. Van Trump was born in Lancaster, Ohio, on December 18,1838. He studied at both Kenyon College and the University of New York, intending to be an attorney. He never practiced law but in 1867 served as secretary to his brother-in-law Washington Territorial Governor Marshal F. Moore and was employed by the National Park Service at Rainier after the park was founded in 1899. (Reese, 2009)
|
STATISTICS AS OF 2021 (Beason et al., 2022):
Aerial Extent:
0.045 ± 0.003 square miles
(0.117 ± 0.009 km2)
(Rank: 28 of 29)
Debris Cover (Based on Beason, 2017 - not updated in 2021):
--No appreciable debris cover in 2015--
Estimated Glacial Volume: (See notes below)
0.0005 cubic miles
(0.0020 km3)
Highest Elevation (Head):
14,334 feet
(4,369 m)
Lowest Elevation (Terminus):
7,540 feet
(2,298 m)
Elevation Range:
6,794 feet
(2,071 m)
Length:
0.30 miles
(0.48 km)
Average Slope:
28°
Average Flow Direction (Flows towards):
South southeast (168°)
|
|
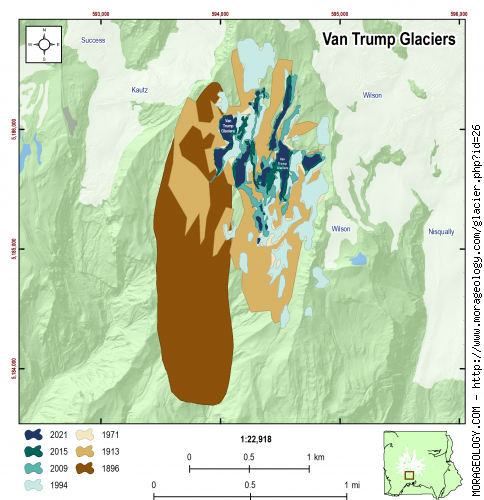
CHANGE IN EXTENT, 1896-2015 (Beason, 2017):
| Units |
1896 |
1913 |
1971 |
1994 |
2009 |
2015 |
2021 |
| Area, mi2 |
0.555 |
0.541 |
0.263 |
0.280 |
0.123 |
0.068 |
0.045 |
| Area, km2 |
1.438 |
1.402 |
0.681 |
0.724 |
0.318 |
0.176 |
0.117 |
Area change between periods
|
1913 |
1971 |
1994 |
2009 |
2015 |
2021 |
| 1896 |
-0.014 mi2
(-0.036 km2) |
-0.292 mi2
(-0.757 km2) |
-0.276 mi2
(-0.714 km2) |
-0.433 mi2
(-1.120 km2) |
-0.487 mi2
(-1.262 km2) |
-0.510 mi2
(-1.321 km2) |
| 1913 |
-- |
-0.278 mi2
(-0.721 km2) |
-0.262 mi2
(-0.678 km2) |
-0.419 mi2
(-1.085 km2) |
-0.473 mi2
(-1.226 km2) |
-0.496 mi2
(-1.285 km2) |
| 1971 |
|
-- |
0.017 mi2
(0.043 km2) |
-0.140 mi2
(-0.364 km2) |
-0.195 mi2
(-0.505 km2) |
-0.218 mi2
(-0.564 km2) |
| 1994 |
|
-- |
-0.157 mi2
(-0.407 km2) |
-0.212 mi2
(-0.548 km2) |
-0.235 mi2
(-0.607 km2) |
| 2009 |
|
-- |
-0.055 mi2
(-0.142 km2) |
-0.078 mi2
(-0.201 km2) |
| 2015 |
|
-- |
-0.023 mi2
(-0.059 km2) |
Percent change between periods
|
1913 |
1971 |
1994 |
2009 |
2015 |
2021 |
| 1896 |
-2.49 % |
-52.62 % |
-49.63 % |
-77.91 % |
-87.76 % |
-91.87 % |
| 1913 |
-- |
-51.42 % |
-48.34 % |
-77.35 % |
-87.45 % |
-91.67 % |
| 1971 |
|
-- |
6.33 % |
-53.38 % |
-74.17 % |
-82.85 % |
| 1994 |
|
-- |
-56.15 % |
-75.71 % |
-83.87 % |
| 2009 |
|
-- |
-44.61 % |
-63.21 % |
| 2015 |
|
-- |
-33.58 % |
|
ESTIMATED CHANGE IN VOLUME, 1896-2021 (Beason et al., 2022; George and Beason, 2017):
PLEASE see important notes about this, below...
| Units |
1896 |
1913 |
1971 |
1981* |
1994 |
2009 |
2015 |
2021 |
| Volume, mi3 |
0.0079 |
0.0077 |
0.0034 |
0.0034 |
0.0036 |
0.0014 |
0.0007 |
0.0005 |
| Volume, km3 |
0.0328 |
0.0319 |
0.0142 |
0.0142 |
0.0152 |
0.0060 |
0.0031 |
0.0020 |
* = 1981 was the only year that glacial volumes have been measured. See note below.
Basal Shear Stress (τ): 2,111.57 lbs/ft2
Volume change between periods
|
1913 |
1971 |
1981 |
1994 |
2009 |
2015 |
2021 |
| 1896 |
-0.0002 mi3
(-0.0009 km3) |
-0.0045 mi3
(-0.0187 km3) |
-0.0045 mi3
(-0.0187 km3) |
-0.0042 mi3
(-0.0176 km3) |
-0.0064 mi3
(-0.0268 km3) |
-0.0071 mi3
(-0.0297 km3) |
-0.0074 mi3
(-0.0309 km3) |
| 1913 |
-- |
-0.0043 mi3
(-0.0177 km3) |
-0.0043 mi3
(-0.0178 km3) |
-0.0040 mi3
(-0.0167 km3) |
-0.0062 mi3
(-0.0259 km3) |
-0.0069 mi3
(-0.0288 km3) |
-0.0072 mi3
(-0.0300 km3) |
| 1971 |
|
-- |
0.0000 mi3
(0.0000 km3) |
0.0002 mi3
(0.0010 km3) |
-0.0020 mi3
(-0.0082 km3) |
-0.0027 mi3
(-0.0111 km3) |
-0.0029 mi3
(-0.0122 km3) |
| 1981 |
|
-- |
0.0002 mi3
(0.0010 km3) |
-0.0020 mi3
(-0.0081 km3) |
-0.0027 mi3
(-0.0111 km3) |
-0.0029 mi3
(-0.0122 km3) |
| 1994 |
|
-- |
-0.0022 mi3
(-0.0092 km3) |
-0.0029 mi3
(-0.0121 km3) |
-0.0032 mi3
(-0.0132 km3) |
| 2009 |
|
-- |
-0.0007 mi3
(-0.0029 km3) |
-0.0010 mi3
(-0.0041 km3) |
| 2015 |
|
-- |
-0.0003 mi3
(-0.0011 km3) |
Percent change between periods
|
1913 |
1971 |
1981 |
1994 |
2009 |
2015 |
2021 |
| 1896 |
-2.79 % |
-56.82 % |
-56.89 % |
-53.73 % |
-81.68 % |
-90.57 % |
-94.05 % |
| 1913 |
-- |
-55.58 % |
-55.65 % |
-52.40 % |
-81.16 % |
-90.30 % |
-93.88 % |
| 1971 |
|
-- |
-0.17 % |
7.14 % |
-57.59 % |
-78.17 % |
-86.21 % |
| 1981 |
|
-- |
7.32 % |
-57.52 % |
-78.13 % |
-86.19 % |
| 1994 |
|
-- |
-60.41 % |
-79.62 % |
-87.13 % |
| 2009 |
|
-- |
-48.52 % |
-67.50 % |
| 2015 |
|
-- |
-36.86 % |
With the exception of data in 1981, all values here are calculated estimates based on work by Driedger and Kennard (1986), which calculates glacier volumes with the following equations:
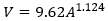
If Glacier Length (L) > 8,500 ft:
If Glacier Length (L) < 8,500 ft:
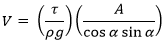
Basal shear stress (τ) is calculated as:
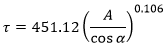
Where V is the calculated volume of the glacier (ft3), A is the calculated area of the glacier (ft2), ρ is the density of ice (1.779 slug/ft3), g is the acceleration of gravity (32.178 ft/s2), and α is the average slope of the glacier.
If you need a really good research project, recalculating the glacier volumes at Mount Rainier is the way to go!
|
NOTES:
Data References:
Beason et al., 2022,
Beason, 2017,
George and Beason, 2017,
Reese, 2009, and
Driedger and Kennard, 1986