Switch Glacier:
NOTE: This page has been updated to show 2021 extents and changes
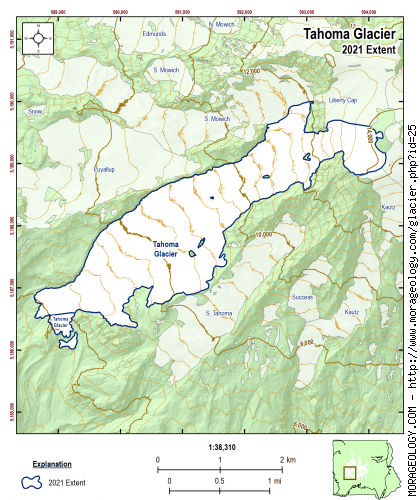
Tahoma Glacier
Two glaciers, Tahoma and South Tahoma, are located on the south side of the Puyallup Glacier on the west side of Mount Rainier. The glaciers are separated by Glacier Island. Tahoma Glacier is south of the Puyallup Glacier and is separated from it by the Puyallup Cleaver. (Reese, 2009)
|
STATISTICS AS OF 2021 (Beason et al., 2022):
Aerial Extent:
2.468 ± 0.131 square miles
(6.392 ± 0.341 km2)
(Rank: 4 of 29)
Debris Cover (Based on Beason, 2017 - not updated in 2021):
0.602 ± 0.036 square miles
(1.560 ± 0.094 km2)
(Rank: 2 of 29)
Estimated Glacial Volume: (See notes below)
0.0586 cubic miles
(0.2444 km3)
Highest Elevation (Head):
14,334 feet
(4,369 m)
Lowest Elevation (Terminus):
5,510 feet
(1,679 m)
Elevation Range:
8,824 feet
(2,690 m)
Length:
4.00 miles
(6.44 km)
Average Slope:
24°
Average Flow Direction (Flows towards):
West southwest (243°)
|
|
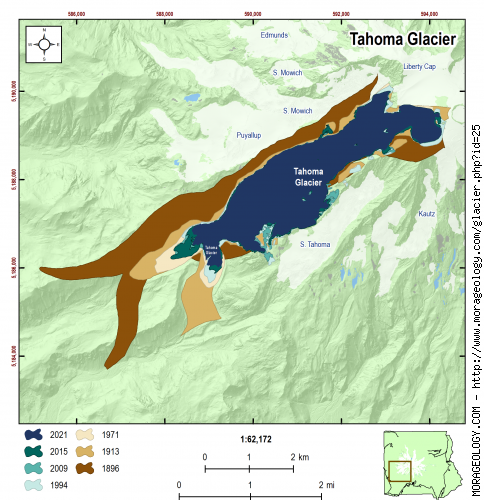
CHANGE IN EXTENT, 1896-2015 (Beason, 2017):
| Units |
1896 |
1913 |
1971 |
1994 |
2009 |
2015 |
2021 |
| Area, mi2 |
4.635 |
3.541 |
2.942 |
2.811 |
2.617 |
2.620 |
2.468 |
| Area, km2 |
12.005 |
9.171 |
7.619 |
7.281 |
6.777 |
6.787 |
6.392 |
Area change between periods
|
1913 |
1971 |
1994 |
2009 |
2015 |
2021 |
| 1896 |
-1.094 mi2
(-2.834 km2) |
-1.693 mi2
(-4.386 km2) |
-1.824 mi2
(-4.724 km2) |
-2.018 mi2
(-5.228 km2) |
-2.015 mi2
(-5.218 km2) |
-2.167 mi2
(-5.612 km2) |
| 1913 |
-- |
-0.599 mi2
(-1.552 km2) |
-0.730 mi2
(-1.890 km2) |
-0.924 mi2
(-2.394 km2) |
-0.920 mi2
(-2.384 km2) |
-1.073 mi2
(-2.779 km2) |
| 1971 |
|
-- |
-0.131 mi2
(-0.338 km2) |
-0.325 mi2
(-0.842 km2) |
-0.321 mi2
(-0.832 km2) |
-0.474 mi2
(-1.226 km2) |
| 1994 |
|
-- |
-0.194 mi2
(-0.504 km2) |
-0.191 mi2
(-0.494 km2) |
-0.343 mi2
(-0.888 km2) |
| 2009 |
|
-- |
0.004 mi2
(0.010 km2) |
-0.148 mi2
(-0.384 km2) |
| 2015 |
|
-- |
-0.152 mi2
(-0.395 km2) |
Percent change between periods
|
1913 |
1971 |
1994 |
2009 |
2015 |
2021 |
| 1896 |
-23.60 % |
-36.53 % |
-39.35 % |
-43.55 % |
-43.46 % |
-46.75 % |
| 1913 |
-- |
-16.92 % |
-20.61 % |
-26.11 % |
-25.99 % |
-30.30 % |
| 1971 |
|
-- |
-4.44 % |
-11.05 % |
-10.92 % |
-16.10 % |
| 1994 |
|
-- |
-6.92 % |
-6.78 % |
-12.20 % |
| 2009 |
|
-- |
0.15 % |
-5.67 % |
| 2015 |
|
-- |
-5.81 % |
|
ESTIMATED CHANGE IN VOLUME, 1896-2021 (Beason et al., 2022; George and Beason, 2017):
PLEASE see important notes about this, below...
| Units |
1896 |
1913 |
1971 |
1981* |
1994 |
2009 |
2015 |
2021 |
| Volume, mi3 |
0.1108 |
0.0847 |
0.0703 |
0.1094 |
0.0672 |
0.0626 |
0.0627 |
0.0586 |
| Volume, km3 |
0.4619 |
0.3529 |
0.2932 |
0.4559 |
0.2802 |
0.2608 |
0.2612 |
0.2444 |
* = 1981 was the only year that glacial volumes have been measured. See note below.
Basal Shear Stress (τ): 3,121.74 lbs/ft2
Volume change between periods
|
1913 |
1971 |
1981 |
1994 |
2009 |
2015 |
2021 |
| 1896 |
-0.0262 mi3
(-0.1090 km3) |
-0.0405 mi3
(-0.1688 km3) |
-0.0014 mi3
(-0.0060 km3) |
-0.0436 mi3
(-0.1818 km3) |
-0.0483 mi3
(-0.2012 km3) |
-0.0482 mi3
(-0.2008 km3) |
-0.0522 mi3
(-0.2175 km3) |
| 1913 |
-- |
-0.0143 mi3
(-0.0597 km3) |
0.0247 mi3
(0.1030 km3) |
-0.0175 mi3
(-0.0727 km3) |
-0.0221 mi3
(-0.0921 km3) |
-0.0220 mi3
(-0.0917 km3) |
-0.0260 mi3
(-0.1085 km3) |
| 1971 |
|
-- |
0.0390 mi3
(0.1627 km3) |
-0.0031 mi3
(-0.0130 km3) |
-0.0078 mi3
(-0.0324 km3) |
-0.0077 mi3
(-0.0320 km3) |
-0.0117 mi3
(-0.0487 km3) |
| 1981 |
|
-- |
-0.0422 mi3
(-0.1757 km3) |
-0.0468 mi3
(-0.1951 km3) |
-0.0467 mi3
(-0.1947 km3) |
-0.0507 mi3
(-0.2115 km3) |
| 1994 |
|
-- |
-0.0047 mi3
(-0.0194 km3) |
-0.0046 mi3
(-0.0190 km3) |
-0.0086 mi3
(-0.0357 km3) |
| 2009 |
|
-- |
0.0001 mi3
(0.0004 km3) |
-0.0039 mi3
(-0.0163 km3) |
| 2015 |
|
-- |
-0.0040 mi3
(-0.0167 km3) |
Percent change between periods
|
1913 |
1971 |
1981 |
1994 |
2009 |
2015 |
2021 |
| 1896 |
-23.60 % |
-36.53 % |
-1.31 % |
-39.35 % |
-43.55 % |
-43.46 % |
-47.09 % |
| 1913 |
-- |
-16.92 % |
29.19 % |
-20.61 % |
-26.11 % |
-25.99 % |
-30.74 % |
| 1971 |
|
-- |
55.51 % |
-4.44 % |
-11.05 % |
-10.92 % |
-16.63 % |
| 1981 |
|
-- |
-38.55 % |
-42.80 % |
-42.72 % |
-46.39 % |
| 1994 |
|
-- |
-6.92 % |
-6.78 % |
-12.75 % |
| 2009 |
|
-- |
0.15 % |
-6.27 % |
| 2015 |
|
-- |
-6.41 % |
With the exception of data in 1981, all values here are calculated estimates based on work by Driedger and Kennard (1986), which calculates glacier volumes with the following equations:
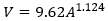
If Glacier Length (L) > 8,500 ft:
If Glacier Length (L) < 8,500 ft:
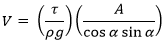
Basal shear stress (τ) is calculated as:
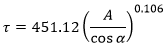
Where V is the calculated volume of the glacier (ft3), A is the calculated area of the glacier (ft2), ρ is the density of ice (1.779 slug/ft3), g is the acceleration of gravity (32.178 ft/s2), and α is the average slope of the glacier.
If you need a really good research project, recalculating the glacier volumes at Mount Rainier is the way to go!
|
NOTES:
Data References:
Beason et al., 2022,
Beason, 2017,
George and Beason, 2017,
Reese, 2009, and
Driedger and Kennard, 1986