Switch Glacier:
NOTE: This page has been updated to show 2021 extents and changes
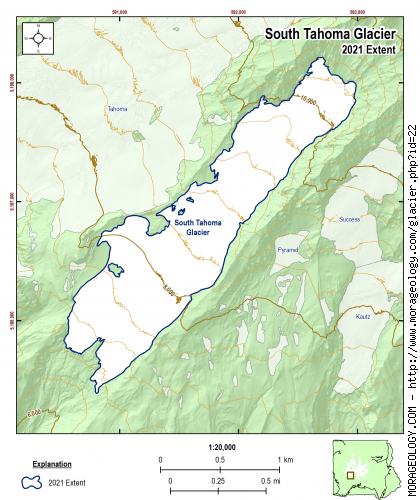
South Tahoma Glacier
The South Tahoma Glacier is south of the Tahoma Glacier on the southwest side of Mount Rainier. The South Tahoma Glacier is separated from the Pyramid Glacier on the southeast by Success Cleaver and is drained by Tahoma Creek. (Reese, 2009)
|
STATISTICS AS OF 2021 (Beason et al., 2022):
Aerial Extent:
0.751 ± 0.042 square miles
(1.945 ± 0.109 km2)
(Rank: 14 of 29)
Debris Cover (Based on Beason, 2017 - not updated in 2021):
0.215 ± 0.015 square miles
(0.557 ± 0.038 km2)
(Rank: 3 of 29)
Estimated Glacial Volume: (See notes below)
0.0162 cubic miles
(0.0675 km3)
Highest Elevation (Head):
10,811 feet
(3,295 m)
Lowest Elevation (Terminus):
6,625 feet
(2,019 m)
Elevation Range:
4,186 feet
(1,276 m)
Length:
2.00 miles
(3.22 km)
Average Slope:
24°
Average Flow Direction (Flows towards):
Southwest (219°)
|
|
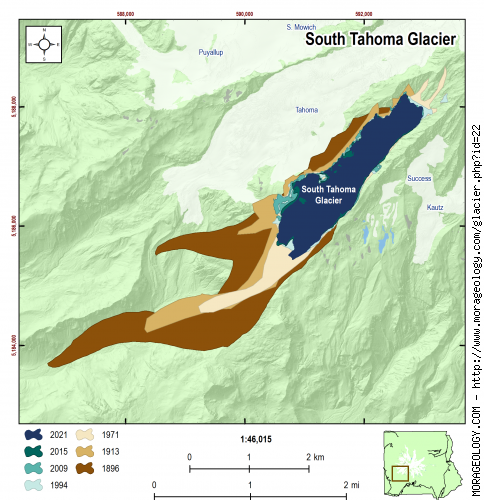
CHANGE IN EXTENT, 1896-2015 (Beason, 2017):
| Units |
1896 |
1913 |
1971 |
1994 |
2009 |
2015 |
2021 |
| Area, mi2 |
2.288 |
1.323 |
1.128 |
0.862 |
0.852 |
0.773 |
0.751 |
| Area, km2 |
5.926 |
3.427 |
2.922 |
2.233 |
2.206 |
2.002 |
1.945 |
Area change between periods
|
1913 |
1971 |
1994 |
2009 |
2015 |
2021 |
| 1896 |
-0.965 mi2
(-2.499 km2) |
-1.160 mi2
(-3.005 km2) |
-1.426 mi2
(-3.694 km2) |
-1.436 mi2
(-3.720 km2) |
-1.515 mi2
(-3.924 km2) |
-1.537 mi2
(-3.982 km2) |
| 1913 |
-- |
-0.195 mi2
(-0.506 km2) |
-0.461 mi2
(-1.195 km2) |
-0.472 mi2
(-1.221 km2) |
-0.550 mi2
(-1.425 km2) |
-0.572 mi2
(-1.483 km2) |
| 1971 |
|
-- |
-0.266 mi2
(-0.689 km2) |
-0.276 mi2
(-0.716 km2) |
-0.355 mi2
(-0.920 km2) |
-0.377 mi2
(-0.977 km2) |
| 1994 |
|
-- |
-0.010 mi2
(-0.027 km2) |
-0.089 mi2
(-0.231 km2) |
-0.111 mi2
(-0.288 km2) |
| 2009 |
|
-- |
-0.079 mi2
(-0.204 km2) |
-0.101 mi2
(-0.261 km2) |
| 2015 |
|
-- |
-0.022 mi2
(-0.057 km2) |
Percent change between periods
|
1913 |
1971 |
1994 |
2009 |
2015 |
2021 |
| 1896 |
-42.17 % |
-50.70 % |
-62.33 % |
-62.78 % |
-66.22 % |
-67.19 % |
| 1913 |
-- |
-14.75 % |
-34.86 % |
-35.63 % |
-41.59 % |
-43.26 % |
| 1971 |
|
-- |
-23.59 % |
-24.49 % |
-31.48 % |
-33.44 % |
| 1994 |
|
-- |
-1.19 % |
-10.34 % |
-12.90 % |
| 2009 |
|
-- |
-9.26 % |
-11.85 % |
| 2015 |
|
-- |
-2.86 % |
|
ESTIMATED CHANGE IN VOLUME, 1896-2021 (Beason et al., 2022; George and Beason, 2017):
PLEASE see important notes about this, below...
| Units |
1896 |
1913 |
1971 |
1981* |
1994 |
2009 |
2015 |
2021 |
| Volume, mi3 |
0.0495 |
0.0286 |
0.0244 |
0.0313 |
0.0186 |
0.0184 |
0.0167 |
0.0162 |
| Volume, km3 |
0.2062 |
0.1193 |
0.1017 |
0.1303 |
0.0777 |
0.0768 |
0.0697 |
0.0675 |
* = 1981 was the only year that glacial volumes have been measured. See note below.
Basal Shear Stress (τ): 2,738.87 lbs/ft2
Volume change between periods
|
1913 |
1971 |
1981 |
1994 |
2009 |
2015 |
2021 |
| 1896 |
-0.0209 mi3
(-0.0870 km3) |
-0.0251 mi3
(-0.1046 km3) |
-0.0182 mi3
(-0.0760 km3) |
-0.0308 mi3
(-0.1285 km3) |
-0.0311 mi3
(-0.1295 km3) |
-0.0328 mi3
(-0.1366 km3) |
-0.0333 mi3
(-0.1388 km3) |
| 1913 |
-- |
-0.0042 mi3
(-0.0176 km3) |
0.0026 mi3
(0.0110 km3) |
-0.0100 mi3
(-0.0416 km3) |
-0.0102 mi3
(-0.0425 km3) |
-0.0119 mi3
(-0.0496 km3) |
-0.0124 mi3
(-0.0518 km3) |
| 1971 |
|
-- |
0.0069 mi3
(0.0286 km3) |
-0.0058 mi3
(-0.0240 km3) |
-0.0060 mi3
(-0.0249 km3) |
-0.0077 mi3
(-0.0320 km3) |
-0.0082 mi3
(-0.0342 km3) |
| 1981 |
|
-- |
-0.0126 mi3
(-0.0526 km3) |
-0.0128 mi3
(-0.0535 km3) |
-0.0145 mi3
(-0.0606 km3) |
-0.0151 mi3
(-0.0628 km3) |
| 1994 |
|
-- |
-0.0002 mi3
(-0.0009 km3) |
-0.0019 mi3
(-0.0080 km3) |
-0.0025 mi3
(-0.0102 km3) |
| 2009 |
|
-- |
-0.0017 mi3
(-0.0071 km3) |
-0.0022 mi3
(-0.0093 km3) |
| 2015 |
|
-- |
-0.0005 mi3
(-0.0022 km3) |
Percent change between periods
|
1913 |
1971 |
1981 |
1994 |
2009 |
2015 |
2021 |
| 1896 |
-42.17 % |
-50.70 % |
-36.84 % |
-62.33 % |
-62.78 % |
-66.22 % |
-67.29 % |
| 1913 |
-- |
-14.75 % |
9.21 % |
-34.86 % |
-35.63 % |
-41.59 % |
-43.43 % |
| 1971 |
|
-- |
28.11 % |
-23.59 % |
-24.49 % |
-31.48 % |
-33.65 % |
| 1981 |
|
-- |
-40.35 % |
-41.06 % |
-46.52 % |
-48.21 % |
| 1994 |
|
-- |
-1.19 % |
-10.34 % |
-13.17 % |
| 2009 |
|
-- |
-9.26 % |
-12.12 % |
| 2015 |
|
-- |
-3.15 % |
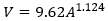
With the exception of data in 1981, all values here are calculated estimates based on work by Driedger and Kennard (1986), which calculates glacier volumes with the following equations:
If Glacier Length (L) > 8,500 ft:
If Glacier Length (L) < 8,500 ft:
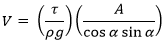
Basal shear stress (τ) is calculated as:
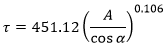
Where V is the calculated volume of the glacier (ft3), A is the calculated area of the glacier (ft2), ρ is the density of ice (1.779 slug/ft3), g is the acceleration of gravity (32.178 ft/s2), and α is the average slope of the glacier.
If you need a really good research project, recalculating the glacier volumes at Mount Rainier is the way to go!
|
NOTES:
Data References:
Beason et al., 2022,
Beason, 2017,
George and Beason, 2017,
Reese, 2009, and
Driedger and Kennard, 1986