Switch Glacier:
NOTE: This page has been updated to show 2021 extents and changes
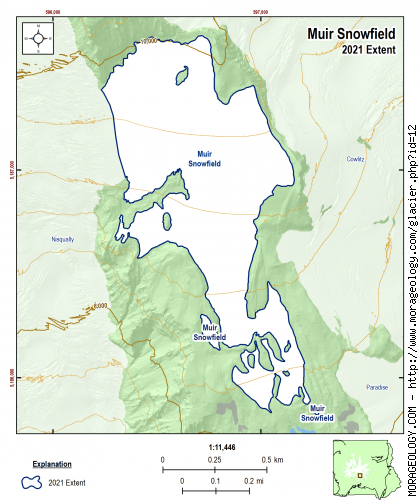
Muir Snowfield
The arm of the Nisqually Glacier upward from McClure Rock to the vicinity of Camp Muir was named Muir Snowfield for John Muir, the naturalist and writer. Muir climbed the mountain in 1888 and selected a site for his overnight camp that had previously been known as Cloud Camp by mountain climbers and is now called Camp Muir. (Reese, 2009)
|
STATISTICS AS OF 2021 (Beason et al., 2022):
Aerial Extent:
0.318 ± 0.019 square miles
(0.823 ± 0.049 km2)
(Rank: 19 of 29)
Debris Cover (Based on Beason, 2017 - not updated in 2021):
--No appreciable debris cover in 2015--
Estimated Glacial Volume: (See notes below)
0.0042 cubic miles
(0.0176 km3)
Highest Elevation (Head):
10,077 feet
(3,071 m)
Lowest Elevation (Terminus):
8,219 feet
(2,505 m)
Elevation Range:
1,858 feet
(566 m)
Length:
1.18 miles
(1.89 km)
Average Slope:
18°
Average Flow Direction (Flows towards):
South (183°)
|
|
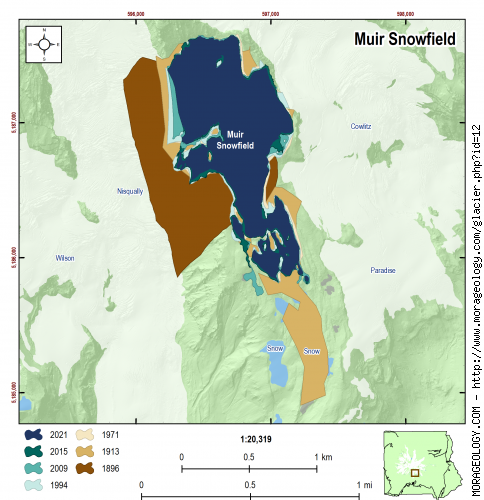
CHANGE IN EXTENT, 1896-2015 (Beason, 2017):
| Units |
1896 |
1913 |
1971 |
1994 |
2009 |
2015 |
2021 |
| Area, mi2 |
0.437 |
0.469 |
0.374 |
0.377 |
0.355 |
0.338 |
0.318 |
| Area, km2 |
1.132 |
1.216 |
0.968 |
0.977 |
0.920 |
0.875 |
0.823 |
Area change between periods
|
1913 |
1971 |
1994 |
2009 |
2015 |
2021 |
| 1896 |
0.032 mi2
(0.084 km2) |
-0.063 mi2
(-0.164 km2) |
-0.060 mi2
(-0.155 km2) |
-0.082 mi2
(-0.212 km2) |
-0.099 mi2
(-0.257 km2) |
-0.119 mi2
(-0.309 km2) |
| 1913 |
-- |
-0.096 mi2
(-0.248 km2) |
-0.092 mi2
(-0.239 km2) |
-0.114 mi2
(-0.296 km2) |
-0.131 mi2
(-0.340 km2) |
-0.151 mi2
(-0.392 km2) |
| 1971 |
|
-- |
0.003 mi2
(0.009 km2) |
-0.018 mi2
(-0.048 km2) |
-0.036 mi2
(-0.093 km2) |
-0.056 mi2
(-0.144 km2) |
| 1994 |
|
-- |
-0.022 mi2
(-0.057 km2) |
-0.039 mi2
(-0.101 km2) |
-0.059 mi2
(-0.153 km2) |
| 2009 |
|
-- |
-0.017 mi2
(-0.045 km2) |
-0.037 mi2
(-0.096 km2) |
| 2015 |
|
-- |
-0.020 mi2
(-0.052 km2) |
Percent change between periods
|
1913 |
1971 |
1994 |
2009 |
2015 |
2021 |
| 1896 |
7.39 % |
-14.50 % |
-13.72 % |
-18.74 % |
-22.68 % |
-27.26 % |
| 1913 |
-- |
-20.39 % |
-19.65 % |
-24.33 % |
-28.00 % |
-32.26 % |
| 1971 |
|
-- |
0.92 % |
-4.95 % |
-9.56 % |
-14.92 % |
| 1994 |
|
-- |
-5.82 % |
-10.39 % |
-15.69 % |
| 2009 |
|
-- |
-4.85 % |
-10.48 % |
| 2015 |
|
-- |
-5.92 % |
|
ESTIMATED CHANGE IN VOLUME, 1896-2021 (Beason et al., 2022; George and Beason, 2017):
PLEASE see important notes about this, below...
| Units |
1896 |
1913 |
1971 |
1981* |
1994 |
2009 |
2015 |
2021 |
| Volume, mi3 |
0.0060 |
0.0065 |
0.0050 |
0.0048 |
0.0051 |
0.0048 |
0.0045 |
0.0042 |
| Volume, km3 |
0.0251 |
0.0272 |
0.0210 |
0.0198 |
0.0213 |
0.0199 |
0.0188 |
0.0176 |
* = 1981 was the only year that glacial volumes have been measured. See note below.
Basal Shear Stress (τ): 2,488.30 lbs/ft2
Volume change between periods
|
1913 |
1971 |
1981 |
1994 |
2009 |
2015 |
2021 |
| 1896 |
0.0005 mi3
(0.0021 km3) |
-0.0010 mi3
(-0.0041 km3) |
-0.0013 mi3
(-0.0053 km3) |
-0.0009 mi3
(-0.0038 km3) |
-0.0013 mi3
(-0.0052 km3) |
-0.0015 mi3
(-0.0063 km3) |
-0.0018 mi3
(-0.0075 km3) |
| 1913 |
-- |
-0.0015 mi3
(-0.0061 km3) |
-0.0018 mi3
(-0.0074 km3) |
-0.0014 mi3
(-0.0059 km3) |
-0.0018 mi3
(-0.0073 km3) |
-0.0020 mi3
(-0.0084 km3) |
-0.0023 mi3
(-0.0096 km3) |
| 1971 |
|
-- |
-0.0003 mi3
(-0.0012 km3) |
0.0001 mi3
(0.0002 km3) |
-0.0003 mi3
(-0.0012 km3) |
-0.0005 mi3
(-0.0022 km3) |
-0.0008 mi3
(-0.0035 km3) |
| 1981 |
|
-- |
0.0003 mi3
(0.0014 km3) |
0.0000 mi3
(0.0001 km3) |
-0.0002 mi3
(-0.0010 km3) |
-0.0005 mi3
(-0.0023 km3) |
| 1994 |
|
-- |
-0.0003 mi3
(-0.0014 km3) |
-0.0006 mi3
(-0.0025 km3) |
-0.0009 mi3
(-0.0037 km3) |
| 2009 |
|
-- |
-0.0003 mi3
(-0.0011 km3) |
-0.0006 mi3
(-0.0023 km3) |
| 2015 |
|
-- |
-0.0003 mi3
(-0.0012 km3) |
Percent change between periods
|
1913 |
1971 |
1981 |
1994 |
2009 |
2015 |
2021 |
| 1896 |
8.34 % |
-16.15 % |
-21.02 % |
-15.28 % |
-20.80 % |
-25.11 % |
-30.07 % |
| 1913 |
-- |
-22.61 % |
-27.10 % |
-21.80 % |
-26.90 % |
-30.87 % |
-35.45 % |
| 1971 |
|
-- |
-5.81 % |
1.04 % |
-5.55 % |
-10.68 % |
-16.60 % |
| 1981 |
|
-- |
7.27 % |
0.28 % |
-5.17 % |
-11.46 % |
| 1994 |
|
-- |
-6.52 % |
-11.60 % |
-17.46 % |
| 2009 |
|
-- |
-5.44 % |
-11.70 % |
| 2015 |
|
-- |
-6.63 % |
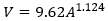
With the exception of data in 1981, all values here are calculated estimates based on work by Driedger and Kennard (1986), which calculates glacier volumes with the following equations:
If Glacier Length (L) > 8,500 ft:
If Glacier Length (L) < 8,500 ft:
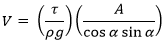
Basal shear stress (τ) is calculated as:
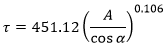
Where V is the calculated volume of the glacier (ft3), A is the calculated area of the glacier (ft2), ρ is the density of ice (1.779 slug/ft3), g is the acceleration of gravity (32.178 ft/s2), and α is the average slope of the glacier.
If you need a really good research project, recalculating the glacier volumes at Mount Rainier is the way to go!
|
NOTES:
Data References:
Beason et al., 2022,
Beason, 2017,
George and Beason, 2017,
Reese, 2009, and
Driedger and Kennard, 1986