NOTE: The data shown here is based on the 2021 glacier update at Mount Rainier, and should be considered the most up-to-date data on glaciers at the park (2023-04-06).
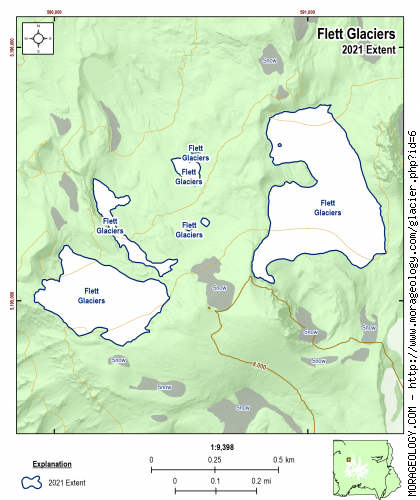
Flett Glacier
This small permanent snow field is near Ptarmigan Ridge on the northwestern slope of Mount Rainier. Professor John B. Flett of the Tacoma Public Schools was for many years one of the most enthusiastic explorers of the mountain area and had the honor of naming a number of locations on the mountain. John B. Flett was born in the Orkney Islands in 1859 and come to the United States in 1874. He graduated in 1885 from Hamilton College with first honors in chemistry, and until 1892 when he came to Tacoma, he was teacher and principal of schools in New York State. He continued this career in Tacoma but also began his botanizing work and in 1896 he went into the Olympics with a party of gold hunters. The next season he went alone, and July 20, 1897, he made his first discovery of a new species, a large and beautiful violet with kidney-shaped leaves. He was a park ranger between 1913 and 1921. (Reese, 2009)
Switch Glacier:
|
STATISTICS AS OF 2021 (Beason et al., 2023):
Aerial Extent:
0.140 ± 0.009 square miles
(0.363 ± 0.023 km2)
(Rank: 25 of 29)
Debris Cover - Based on data from 2015 (Beason, 2017):
--No appreciable debris cover in 2015--
Estimated Glacier Volume: (See notes below)
0.0017 ± 0.0006 cubic miles
(0.0069 ± 0.0024 km3)
Highest Elevation (Head):
7,951 feet
(2,423 m)
Lowest Elevation (Terminus):
7,120 feet
(2,170 m)
Elevation Range:
831 feet
(253 m)
Length:
0.41 miles
(0.66 km)
Average Slope:
20.18°
Average Flow Direction (direction the glacier flows towards):
North (356°)
Glacier Type:
C - Cirque Glacier, or Glacier Head Starts Below Summit |
|
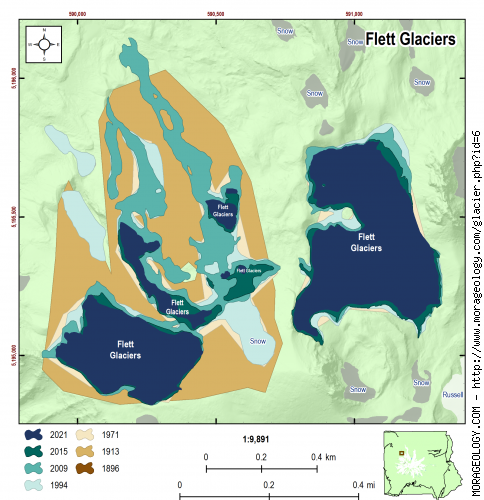
CHANGE IN EXTENT, 1896-2021 (Beason et al., 2023):
| Units |
1896 |
1913 |
1971 |
1994 |
2009 |
2015 |
2021 |
| Area, mi2 |
-- |
0.284 |
0.223 |
0.238 |
0.225 |
0.157 |
0.140 |
| Area, km2 |
-- |
0.737 |
0.576 |
0.615 |
0.582 |
0.406 |
0.363 |
Area Change Between Periods
|
1913 |
1971 |
1994 |
2009 |
2015 |
2021 |
| 1896 | -- | -- | -- | -- | -- | -- |
|---|
| 1913 | -- | -0.062 mi2
(-0.160 km2) | -0.047 mi2
(-0.121 km2) | -0.060 mi2
(-0.155 km2) | -0.128 mi2
(-0.331 km2) | -0.144 mi2
(-0.374 km2) |
|---|
| 1971 | | -- | 0.015 mi2
(0.039 km2) | 0.002 mi2
(0.006 km2) | -0.066 mi2
(-0.171 km2) | -0.082 mi2
(-0.214 km2) |
|---|
| 1994 | | | -- | -0.013 mi2
(-0.033 km2) | -0.081 mi2
(-0.210 km2) | -0.097 mi2
(-0.252 km2) |
|---|
| 2009 | | | | -- | -0.068 mi2
(-0.176 km2) | -0.085 mi2
(-0.219 km2) |
|---|
| 2015 | | | | | -- | -0.016 mi2
(-0.043 km2) |
|---|
Percent Change Between Periods
|
1913 |
1971 |
1994 |
2009 |
2015 |
2021 |
| 1896 | -- | -- | -- | -- | -- | -- |
|---|
| 1913 | -- | -21.74% | -16.46% | -20.99% | -44.93% | -50.73% |
|---|
| 1971 | | -- | 6.75% | 0.97% | -29.63% | -37.04% |
|---|
| 1994 | | | -- | -5.42% | -34.08% | -41.02% |
|---|
| 2009 | | | | -- | -30.30% | -37.64% |
|---|
| 2015 | | | | | -- | -10.53% |
|---|
|
|
ESTIMATED CHANGE IN VOLUME, 1896-2021 (Beason et al., 2023):
PLEASE see important notes about this, below...
Glacier-specific Scaling Parameter, c:
0.030023
| Units |
1896 |
1913 |
1971 |
1994 |
2009 |
2015 |
2021 |
| Volume, mi3 |
-- |
0.0044 |
0.0031 |
0.0034 |
0.0032 |
0.0019 |
0.0017 |
| Volume, km3 |
-- |
0.0183 |
0.0131 |
0.0143 |
0.0132 |
0.0081 |
0.0069 |
Volume Change Between Periods
|
1913 |
1971 |
1994 |
2009 |
2015 |
2021 |
| 1896 | -- | -- | -- | -- | -- | -- |
|---|
| 1913 | -- | -0.001 mi3
(-0.005 km3) | -0.001 mi3
(-0.004 km3) | -0.001 mi3
(-0.005 km3) | -0.002 mi3
(-0.010 km3) | -0.003 mi3
(-0.011 km3) |
|---|
| 1971 | | -- | 0.000 mi3
(0.001 km3) | 0.000 mi3
(0.000 km3) | -0.001 mi3
(-0.005 km3) | -0.001 mi3
(-0.006 km3) |
|---|
| 1994 | | | -- | 0.000 mi3
(-0.001 km3) | -0.001 mi3
(-0.006 km3) | -0.002 mi3
(-0.007 km3) |
|---|
| 2009 | | | | -- | -0.001 mi3
(-0.005 km3) | -0.002 mi3
(-0.006 km3) |
|---|
| 2015 | | | | | -- | 0.000 mi3
(-0.001 km3) |
|---|
Percent Change Between Periods
|
1913 |
1971 |
1994 |
2009 |
2015 |
2021 |
| 1896 | -- | -- | -- | -- | -- | -- |
|---|
| 1913 | -- | -28.50% | -21.81% | -27.55% | -55.79% | -62.03% |
|---|
| 1971 | | -- | 9.35% | 1.32% | -38.17% | -46.90% |
|---|
| 1994 | | | -- | -7.34% | -43.46% | -51.44% |
|---|
| 2009 | | | | -- | -38.98% | -47.59% |
|---|
| 2015 | | | | | -- | -14.12% |
|---|
Important comments about the calculation of volume shown here
The calculation of glacial volume shown on this page is based on an analysis of two methods used at Mount Rainier in the past (Driedger and Kennard [1986]; and Nylen [2001]) as well as the most recent literature review for glacier area-volume scaling (Please review Beason et al. [2023] for an in-depth discussion about this issue). It should be noted that simply converting area to volume with an equation is extremely difficult and the values presented here have extremely large error margins (likely ± 35% or more). With that in mind, the values presented here should give you an estimate of the glacial volume and change in volume over time. Please use these data very carefully with those caveats.
The calcuation of the volume is as follows:
\[V_i = {(c_iA_i^{1.375}) + (c_nA_i^{1.36}) \over 2}\]
Where:
\(V_i\) = Average volume for the glacier in question (km3);
\(c_i\) = The glacier-specific scaling parameter (back-calculated from glacier area and volume in 1971 in Driedger and Kennard (1986); Method described in Beason et al. (2023). The value for the Flett Glacier is 0.030023 (this is also listed above the volume graph);
\(c_n\) = The back-calculated scaling parameter from Nylen (2001) of 0.0255; and
\(A_i\) = The measured volume of the glacier in question (km2).
This is essentially an average of the back-calculated Dreidger and Kennard (1986) and Nylen (2001) methods (D&K is in the first parenthesis; Nylen in the second). For example, for the Flett Glacier in 2021, you can find the following individual volumes:
Back-calculated Dreidger and Kennard (1986) Method: 0.0018 mi3 (0.0075 km3).
Back-calculated Nylen (2001) Method: 0.0015 mi3 (0.0064 km3).
Average of the two (above equation and values listed for 2021 here): 0.0017 mi3 (0.0069 km3).
Official volume estimate listed above, with error: 0.0017 ± 0.0006 mi3 (0.0069 ± 0.0024 km3).
As you can see, the D&K method tends to produce higher values and Nylen produces lower values; the average of these two methods probably estimates the glacial volume. Until further research is done in this area and we can develop a better method or equation to determine volumes, this is the method we are using to determine glacial volumes. For more information about this method, please read the methods section of Beason et al. (2023).
|
NOTES:
Area was not measured for this glacier in 1896
RAW DATA: